Use these links to rapidly review the document
TABLE OF CONTENTS
HUNTSMAN INTERNATIONAL LLC AND SUBSIDIARIES ITEMS 8 AND 15(a) INDEX TO CONSOLIDATED FINANCIAL STATEMENTS
SECURITIES AND EXCHANGE COMMISSION
WASHINGTON, D.C. 20549
Form 10-K
| (Mark One) | |
ý |
ANNUAL REPORT PURSUANT TO SECTION 13 OR 15(d) OF THE SECURITIES EXCHANGE ACT OF 1934 |
For the fiscal year ended December 31, 2003 |
|
OR |
|
o |
TRANSITION REPORT PURSUANT TO SECTION 13 OR 15(d) OF THE SECURITIES EXCHANGE ACT OF 1934 |
For the transition period from to |
|
Commission file number 333-85141
HUNTSMAN INTERNATIONAL LLC
(Exact name of registrant as specified in its charter)
| Delaware | 87-0630358 | |
| (State or other jurisdiction of incorporation or organization) |
(I.R.S. Employer Identification No.) |
500 Huntsman Way
Salt Lake City, Utah 84108
(801) 584-5700
(Address of principal executive offices and telephone number)
Securities registered pursuant to Section 12(b) of the Act: None
Securities registered pursuant to Section 12(g) of the Act: None
Indicate by check mark whether the Registrant: (1) has filed all reports required to be filed by Section 13 or 15(d) of the Securities Exchange Act of 1934 during the preceding 12 months (or for such shorter period that the Registrant was required to file such reports), and (2) has been subject to such filing requirements for the past 90 days. YES ý NO o
Indicate by check mark if disclosure of delinquent filers pursuant to Item 405 of Regulation S-K is not contained herein, and will not be contained, to the best of the Registrant's knowledge, in definitive proxy or information statements incorporated by reference in Part III of this Form 10-K of any amendment to this Form 10-K. ý
Indicate by check mark whether the Registrant is an accelerated filer (as defined in Exchange Act Rule 12b-2). YES o NO ý
On June 30, 2003, the last business day of Registrant's second fiscal quarter, 1,000 units of membership interest of Registrant were outstanding. There is no established trading market for Registrant's units of membership interest. All of Registrant's units of membership interest are held by an affiliate. Accordingly, the market value of units of membership interest held by non-affiliates is zero.
HUNTSMAN INTERNATIONAL LLC AND SUBSIDIARIES
2003 FORM 10-K ANNUAL REPORT
TABLE OF CONTENTS
HUNTSMAN INTERNATIONAL LLC AND SUBSIDIARIES
2003 FORM 10-K ANNUAL REPORT
Some of the statements contained in this report are forward-looking in nature. In some cases, you can identify forward-looking statements by terminology such as "believes," "expects," "may," "will," "should," "anticipates" or "intends" or the negative of such terms or other comparable terminology, or by discussions of strategy. You are cautioned that our business and operations are subject to a variety of risks and uncertainties, and, consequently, our actual results may materially differ from those projected by any forward-looking statements. Some of those risks and uncertainties are discussed below in "Item 7—Management's Discussion and Analysis of Financial Condition and Results of Operations—Cautionary Statement for Forward-Looking Information" and elsewhere in this report.
This report includes information with respect to market share, industry conditions and forecasts that we obtained from internal industry research, publicly available information (including industry publications and surveys), and surveys and market research provided by consultants (including Nexant, Inc. ("Nexant ChemSystems"), an international consulting and research firm, and International Business Management Associates ("IBMA"), an industry research and consulting firm). The publicly available information and the reports, forecasts and other research provided by consultants generally state that the information contained therein has been obtained from sources believed to be reliable, but there can be no assurance as to the accuracy and completeness of such information. We have not independently verified any of the data from third-party sources, nor have we ascertained the underlying economic assumptions relied upon therein. Similarly, our internal research and forecasts are based upon our management's understanding of industry conditions, and such information has not been verified by any independent sources. As is noted, certain statements in this report are based on information provided by consultants that we commissioned to provide us with the referenced information.
Ownership and History
Our company, Huntsman International LLC, is a Delaware limited liability company. For convenience in this report, the terms "Company," "our," "us" or "we" may be used to refer to Huntsman International LLC and, unless the context otherwise requires, its subsidiaries. In this report, the term "HIH" refers to Huntsman International Holdings LLC, the term "Huntsman Specialty" refers to Huntsman Specialty Chemicals Corporation, the term "HMP" refers to HMP Equity Holdings Corporation, the term "HGI" refers to Huntsman Group Inc., the term "Huntsman Holdings" refers to Huntsman Holdings, LLC, the term "AdMat" refers to Huntsman Advanced Materials LLC and, unless the context otherwise requires, its subsidiaries, the term "GOP" refers to MatlinPatterson Global Opportunities Partners, L.P. and its affiliates, the term "CPH" refers to Consolidated Press Holdings Limited and its subsidiaries and the term "ICI" refers to Imperial Chemical Industries PLC and its subsidiaries. Unless the context otherwise requires, references to our affiliate, Huntsman LLC (formerly Huntsman Corporation), include its subsidiaries.
Our Company is 100% owned by HIH and was formed in 1999 in connection with a transaction between HIH, Huntsman Specialty and ICI. In that transaction, on June 30, 1999, HIH acquired ICI's polyurethane chemicals, selected petrochemicals and titanium dioxide ("TiO2" or "Tioxide") businesses and Huntsman Specialty's propylene oxide ("PO") business. HIH also acquired the 20% ownership interest of BP Chemicals Limited ("BP Chemicals") in an olefins facility located at Wilton, U.K. and certain related assets. HIH then transferred the acquired businesses to us and to our subsidiaries. As a result of these transactions, HIH was owned 60% by Huntsman Specialty, 30% by ICI and 10% by institutional investors.
1
In August 2000, we completed our acquisition of the Morton global TPU business from The Rohm and Haas Company ("Rohm and Haas"); in February 2001, we completed our acquisition of the global ethyleneamines business of Dow Chemical Company ("Dow Chemical"); and, in April 2001, we completed our acquisition of the Albright & Wilson European surfactants business from Rhodia S.A ("Rhodia").
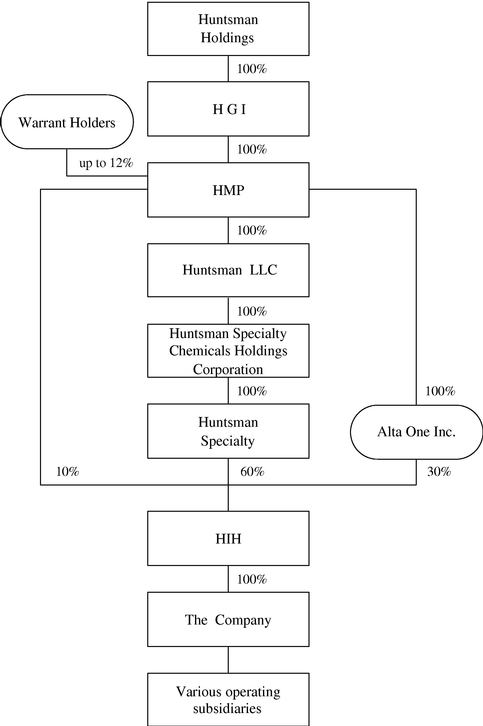
In 2002, HMP purchased approximately 1% of the HIH membership interests held by an institutional investor. On May 9, 2003, HMP exercised an option and purchased the ICI subsidiary ("Alta One") that held ICI's 30% membership interest in HIH. At that time, HMP also purchased the remaining approximately 9% of the HIH membership interests held by institutional investors. As a result, HMP now owns directly, and indirectly through its ownership of Huntsman Specialty and Alta One, 100% of the HIH membership interests. HMP's acquisition of the HIH membership interests held by ICI and the remaining institutional investors is referred to in this report as the "HIH Consolidation Transaction."
HMP is a Delaware corporation and is 100% owned by HGI, a Delaware corporation, subject to warrants which, if exercised, would entitle the holders to up to 12% of the common equity of HMP. HGI is 100% owned by Huntsman Holdings, a Delaware limited liability company. The voting membership interests of Huntsman Holdings are owned by the Huntsman family, GOP, CPH and certain members of our senior management. In addition, Huntsman Holdings has issued certain non-voting preferred units to Huntsman Holdings Preferred Member LLC, which, in turn, is owned by GOP (indirectly), CPH, the Huntsman Cancer Foundation, certain members of our senior management and certain members of the Huntsman family. Huntsman Holdings has also issued certain non-voting preferred units to the Huntsman family, GOP and CPH that track the performance of the AdMat business. The Huntsman family has board and operational control of our Company. The chart below shows our current company structure, together with equity interest ownership:
2
Ownership Structure
3
Amendment of HI Credit Facilities and Refinancing of Term A Loan
On October 17, 2003, we amended our senior secured credit facilities (the "HI Credit Facilities"). The amendment provides, among other things, for changes to certain financial covenants, including an increase in the leverage and interest coverage ratios, a decrease in the annual amount of permitted capital expenditures, and a decrease in the consolidated net worth covenant. With the exception of the changes relating to capital expenditures, these changes to the financial covenants applied to the quarterly period ended September 30, 2003 and will continue through the quarterly period ended December 31, 2004. The amendment also allowed for the issuance of $205 million of additional term B and term C loans, which we accomplished on October 22, 2003, the net proceeds of which were applied to pay down our revolving loan facility by approximately $53 million, and the remainder of the net proceeds were applied to repay, in full, the term A loan. As a result of this refinancing, we have no scheduled maturities in 2004 and scheduled maturities of approximately $12 million in each of 2005 and 2006 under our term B and term C loans. The amendment also allows us to issue additional senior unsecured notes up to a maximum of $800 million.
Chinese MDI Joint Venture
In January 2003, we entered into two related joint venture agreements to build MDI production facilities near Shanghai, China. One joint venture, with BASF AG ("BASF") and three Chinese chemical companies (the "Manufacturing JV"), will build three plants to manufacture mono-nitrobenzene ("MNB"), aniline, and crude MDI. We effectively own 35% of the Manufacturing JV. The other joint venture, with Shanghai Chlor-Alkali Chemical Company, Ltd. (the "Splitting JV"), will build a plant to manufacture pure MDI, polymeric MDI and MDI variants. We own 70% of the Splitting JV. A feasibility study for the project has been approved by the appropriate Chinese authorities, preliminary engineering work has commenced and a business license was issued on March 7, 2003.
The project will be funded by a combination of equity invested by the joint venture partners and borrowed funds. We anticipate that our investment in the joint ventures and other related capital costs will be approximately $85 million. On November 13, 2003, the joint venture partners announced their intention to increase the production capacity of the Manufacturing JV from 160,000 to 240,000 metric tons per year. This change increased our expected share of the capital cost by approximately $10 million, from $75 million to $85 million.
On September 19, 2003, the joint ventures obtained secured financing for the construction of the production facilities. The Manufacturing JV obtained term loans for the construction of its plant in the maximum principal amount of approximately $218.4 million, a working capital credit line in the amount of approximately $4.5 million, and a facility for funding VAT payments in the amount of approximately $1.5 million. The Splitting JV obtained term loans for the construction of its plant in the maximum principal amount of approximately $82.4 million, a working capital credit line in the amount of approximately $35.1 million, and a facility for funding VAT payments in the amount of approximately $0.6 million. The financing is non-recourse to our Company, but will be guaranteed during the construction phase by affiliates of the joint venture, including Huntsman Holdings. Huntsman Holdings unconditionally guarantees 35% of any amounts due and unpaid by the Manufacturing JV under the loans described above (except for the VAT facility which is not guaranteed), and 70% of any amounts due and unpaid by the Splitting JV under the loans described above (except for the VAT facility which is not guaranteed). Huntsman Holdings' guarantees remain in effect until the relevant joint venture has (i) commenced production at least 70% of capacity for at least 30 days, and (ii) achieved a debt service cover ratio of at least 1:1.
4
Restatements of Financial Statements
In February 2004, we discovered an error in accounting for product exchange balances under a toll processing agreement with a customer. The error was caused by the use of an incorrect exchange factor in our new SAP-based enterprise resource planning ("ERP") system. The use of the incorrect exchange factor resulted from the implementation of and transition to our new SAP-based ERP system in 2003. As a result of the discovery of this error we filed an amended quarterly report on Form 10-Q/A with the SEC on February 10, 2004 to restate our financial statements for the three months and the nine months ended as of September 30, 2003 to correct the effect of this error and to adjust certain other items which, considered in relation to the financial statements taken as a whole, were not material. The restatement had the effect of increasing our net loss for the nine months ended September 30, 2003 by $12.3 million.
In March 2004, our management discovered that we had inappropriately calculated foreign exchange gains and losses with respect to our accounts receivable securitization program and had incorrectly classified the foreign exchange gains and losses on the securitized receivables denominated in foreign currency in our consolidated statements of operations for each of the first three quarters of 2003. As a result, we have restated our consolidated financial statements to decrease net loss for each of the first three quarters of 2003 to correct the accounting and classification of foreign exchange gains and losses related to the accounts receivable securitization program. A summary of the significant effects of this restatement is presented in "Note 22—Selected Unaudited Quarterly Financial Data" to the accompanying audited consolidated financial statements.
Construction of LDPE Facility
We believe that the cost position of our Wilton, U.K. olefins facility uniquely positions it to be the site of a polyethylene production facility. While we export approximately one-third of our ethylene production each year to continental Europe, incurring significant shipping and handling costs, the U.K. annually imports approximately 1.9 billion pounds of polyethylene. We believe this provides an opportunity to capitalize on the low-cost operating environment and extensive petrochemical infrastructure and logistics at Wilton, and we are engaged in a feasibility study with respect to the possible construction of a world-scale low density polyurethane ("LDPE") facility at our Wilton site. The potential LDPE facility under study would have the capacity to produce approximately 900 million pounds of LDPE annually and is estimated to cost $275 million to $300 million to construct. We have had preliminary discussions with governmental authorities concerning potential assistance and other matters in connection with the potential project, and we may seek the necessary board and other approvals for the project this year. If such approvals are granted this year, the facility could be operational in late 2006.
5
We derive our revenues, earnings and cash flow from the sale of a wide variety of chemical products. We manufacture these products at facilities located in North America, Europe, Asia and Africa, and our products are sold throughout the world.
Our products are divided into two broad categories—differentiated and commodity chemicals. We manage our business through four segments: Polyurethanes, Performance Products, Pigments and Base Chemicals. Our Polyurethanes and Performance Products businesses mainly produce differentiated products and our Pigments and Base Chemicals businesses mainly produce commodity chemicals. Among our commodity products, our Pigments business, while cyclical, tends to follow different trends and is not influenced by the same factors as our petrochemical-based commodity products. In addition, there are a limited number of significant competitors in our Pigments business, relatively high barriers to entry and strong customer loyalty. Each of our four operating segments is impacted to varying degrees by economic conditions, prices of raw materials and global supply and demand pressures.
Historically, the demand for many of our Polyurethanes products, which accounted for 44% of our revenues in 2003, has been relatively resistant to changes in global economic conditions as industry growth in product demand has been strongly influenced by continuing product substitution, innovation and new product development. The stability of demand has also benefited from the wide variety of end markets for our Polyurethanes products. Historically, sales volumes of MDI, a Polyurethanes segment product, have grown at rates in excess of global GDP growth and margins for MDI have been relatively stable. However, in the past year, volatile feedstock pricing has negatively impacted overall margins. The global market for PO, also a Polyurethanes product, is influenced by supply and demand imbalances. PO demand is largely driven by growth in the polyurethane industry, and, as a result, growth rates for PO have generally exceeded GDP growth rates. As a co-product of our PO manufacturing process, we also produce MTBE. MTBE is an oxygenate that is blended with gasoline to reduce harmful vehicle emissions and to enhance the octane rating of gasoline. See "Business—Polyurethanes—MTBE Developments" below for more information on the legal and regulatory developments that may curtail or eliminate the use of MTBE in gasoline in the future.
In 2003, Performance Products accounted for 13% of our revenues. In comparison to commodity businesses, the demand for many of the products we produce in our Performance Products segment historically has also been relatively resistant to changes in global economic conditions. Like our Polyurethanes segment, Performance Products growth in general is strongly influenced by product substitution, innovation and new product development. Also, demand stability benefits from a broad range of end markets. A significant portion of our Performance Products is sold into consumer end use applications including household detergents, personal care products and cosmetics. As such, historically, demand for these products has been relatively stable and tends to be less susceptible to changes in global economic conditions.
Historically, growth in demand for TiO2 pigments has generally been linked with GDP growth rates and has trended somewhat below overall GDP growth rates as strong growth in the developing world economies has been tempered by modest growth in the developed world economies. Our Pigments segment accounted for 19% of our 2003 revenues. Pigment prices have historically reflected industry-wide operating rates, but have typically lagged behind movements in these rates by up to twelve months due to the effects of product stocking and destocking by customers and suppliers, contract arrangements and cyclicality. The industry experiences some seasonality in its sales because sales of paints in Europe and North America, the largest end use for TiO2, are generally highest in the spring and summer months in those regions. This results in greater sales volumes in the first half of the year because the proportion of our TiO2 products sold in Europe and North America is greater than that sold in the southern hemisphere.
6
Base Chemicals accounted for 24% of our 2003 revenues. Many of the markets for Base Chemicals products, particularly ethylene, propylene, paraxylene and cyclohexane, are cyclical and sensitive to changes in the balance between supply and demand, the price of raw materials, and the level of general economic activity. Historically, these markets have experienced alternating periods of tight supply and rising prices and profit margins, followed by periods of capacity additions resulting in over-capacity and falling prices and profit margins. Demand for the majority of our Base Chemicals has generally grown at rates that are approximately equal to or slightly greater than GDP growth. Market conditions during recent years have been characterized by a general weakening in demand and overcapacity. We believe that weak economic conditions have resulted in a contraction in production capacity. If this contraction in industry capacity is sustained and if demand growth returns to the rates which have been achieved historically, we believe that industry profitability will improve.
Operating segments are components of our business for which separate financial information is available that is evaluated regularly by our senior management in deciding how to allocate resources and in assessing performance. Prior to 2002, we had three operating segments classified by product types: Specialty Chemicals, Petrochemicals and Tioxide. During the first quarter 2002, we reorganized our operations under four operating segments classified by product types: Polyurethanes (our polyurethanes and PO business); Base Chemicals (our olefins and aromatics business in the U.K.); Pigments (our TiO2 business); and Performance Products (our surfactants, ethyleneamines and other performance chemicals business). The most significant change was the split of the former Specialty Chemicals segment into two segments: Polyurethanes and Performance Products. The former Tioxide segment was renamed Pigments, and the former Petrochemicals segment was renamed Base Chemicals. Each of these operating segments has a separate president and operating management. Segment information in this report with respect to 2001 has been restated for comparative purposes. For more information on our operating segments and geographic information, see the following and "Note 21—Industry Segment and Geographic Area Information" to our consolidated financial statements included elsewhere in this report.
Polyurethanes
Polyurethanes—General
We market a complete line of polyurethane chemicals, including MDI, TDI, TPU, polyols, polyurethane systems and aniline, with an emphasis on MDI-based chemicals. Our customers produce polyurethane products through the combination of an isocyanate, such as MDI or TDI, with polyols, which are derived largely from PO and ethylene oxide. Primary polyurethane end-uses include automotive interiors, refrigeration and appliance insulation, construction products, footwear, furniture cushioning, adhesives and other specialized engineering applications.
Our Polyurethanes business is widely recognized as an industry leader in utilizing state-of-the-art application technology to develop new polyurethane chemical products and applications. Approximately 25% of our 2003 Polyurethanes sales were generated from products and applications introduced in the previous three years. Our rapid rate of new product and application development has led to a high rate of product substitution, which in turn has led to strong MDI sales volume growth. Largely as a result of our technological expertise and history of product innovation, we have enjoyed long-term relationships with users of our products, including BMW, Weyerhaeuser, Nike, Louisiana Pacific, DaimlerChrysler, Whirlpool and Electrolux.
According to Nexant ChemSystems in a study we commissioned, we own the world's two largest MDI production facilities in terms of capacity, located in Geismar, Louisiana and Rozenburg, Netherlands. Aniline is a primary material used in the production of MDI. These facilities receive
7
aniline from our own facilities located in Geismar, Louisiana and Wilton, U.K., which in terms of production capacity are the world's two largest aniline facilities. We believe that this vertical integration provides a significant competitive advantage over non-integrated producers. In addition to reducing transportation costs for our raw materials, vertical integration helps reduce our exposure to cyclical prices. According to Nexant ChemSystems in a study we commissioned, we are among the lowest cost MDI producers in the world, largely due to the scale of our operations, our modern facilities and our integration with our suppliers of the products' primary raw materials.
We are a leading producer of PO. Our customers process PO into derivative products such as polyols for polyurethane products, propylene glycol ("PG"), and various other chemical products. End uses for these derivative products include applications in the home furnishings, construction, appliance, packaging, automotive and transportation, food, paints and coatings and cleaning products industries. We are also, according to Nexant ChemSystems in a study we commissioned, a leading U.S. marketer of PG, which is used primarily to produce unsaturated polyester resins ("UPR") for bath and shower enclosures and boat hulls, and to produce heat transfer fluids and solvents. As a co-product of our PO manufacturing process, we also produce MTBE. MTBE is an oxygenate that is blended with gasoline to reduce harmful vehicle emissions and to enhance the octane rating of gasoline. See "—MTBE Developments" for a further discussion of legal and regulatory developments that may curtail or eliminate the use of MTBE in gasoline in the future.
We use our proprietary technology to manufacture PO and MTBE at our state-of-the-art facility in Port Neches, Texas. This facility, which is the most recently built PO manufacturing facility in North America, was designed and built under the supervision of Texaco and began commercial operations in August 1994. According to Nexant ChemSystems in a study we commissioned, we are among the lowest cost PO producers in North America largely due to our manufacturing process. Since acquiring the facility in 1997, we have increased its PO capacity by approximately 30% through a series of low-cost process improvement projects. The current capacity of our PO facility is approximately 525 million pounds of PO per year. We have the capacity to produce 130 million pounds of PG per year at a facility in Port Neches, Texas.
In August 2000, we completed our acquisition of Rohm and Haas' TPU business. The acquired TPU business added production capacity in Osnabrück, Germany and Ringwood, Illinois, complementing our existing footwear-based TPU business.
Our Polyurethanes business accounted for 44%, 46% and 45% of our net sales in 2003, 2002 and 2001, respectively.
Polyurethanes—Industry Overview
The polyurethane chemicals industry is estimated to be a $30 billion global market, consisting primarily of the manufacture and marketing of MDI, TDI and polyols, according to Nexant ChemSystems.
In 2003, according to Nexant ChemSystems, MDI, TDI, polyols and other products, such as specialized additives and catalysts, accounted for 29%, 14%, 33% and 24% of industry-wide polyurethane chemicals sales, respectively. MDI is used primarily in rigid foam; conversely, TDI is used primarily in flexible foam applications that are generally sold as commodities. Polyols, including polyether and polyester polyols, are used in conjunction with MDI and TDI in rigid foam, flexible foam and other non-foam applications. TPU is used in flexible elastomers and other specialty non-foam applications. PO, one of the principal raw materials for polyurethane chemicals, is primarily used in
8
consumer durables. The following chart illustrates the range of product types and end uses for polyurethane chemicals:
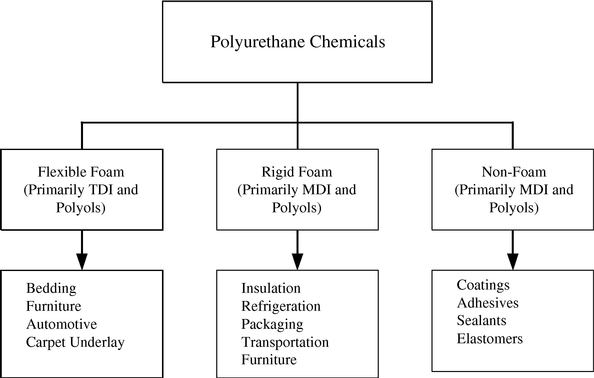
Polyurethane products are created through the reaction of MDI or TDI with a polyol. Polyurethane chemicals are sold to customers who react the chemicals to produce polyurethane products. Depending on their needs, customers will use either commodity polyurethane chemicals produced for mass sales or specialty polyurethane chemicals tailored for their specific requirements. By varying the blend, additives and specifications of the polyurethane chemicals, manufacturers are able to produce and develop a breadth and variety of polyurethane products. The following table sets forth information regarding the three principal polyurethane chemicals markets.
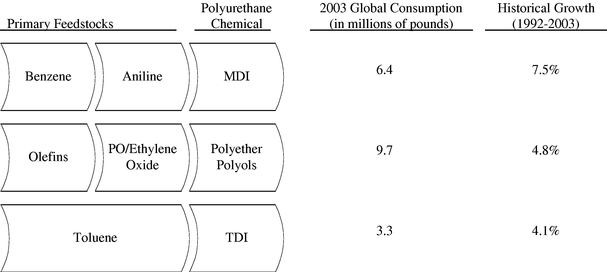
Source: Nexant ChemSystems
9
MDI
As reflected in the chart above, MDI has a substantially larger market size and a higher growth rate than TDI primarily because MDI can be used to make polyurethanes with a broader range of properties and can therefore be used in a wider range of applications than TDI. Nexant ChemSystems reports that future growth of MDI is expected to be driven by the continued substitution of MDI-based polyurethane for fiberglass and other materials currently used in insulation foam for construction. Other markets, such as binders for reconstituted wood board products, are expected to further contribute to the continued growth of MDI.
According to Nexant ChemSystems, global consumption of MDI was approximately 6.4 billion pounds in 2003, growing from 2.9 billion pounds in 1992, which represents a 7.5% compound annual growth rate. This growth rate is the result of the broad end-uses for MDI and its superior performance characteristics relative to other polymers. The U.S. and European markets consume the largest quantities of MDI. With the recovery of the Asian economies, the Asian markets are becoming an increasingly important market for MDI and we currently believe that demand for MDI in Asia will continue to increase as its less developed economies continue to mature.
There are four major producers of MDI: Bayer AG ("Bayer"), our Company, BASF and Dow Chemical, which, according to Nexant ChemSystems in research we commissioned, had global market shares of 26%, 23%, 18% and 18%, respectively, in 2003. We believe it is unlikely that any new major producers of MDI will emerge due to the substantial requirements for entry, such as the limited availability of licenses for MDI technology and the substantial capital commitment that is required to develop both the necessary technology and the infrastructure to manufacture and market MDI.
The price of MDI tends to vary by region and by product type. In the Americas, the margin between MDI prices and raw material costs has historically remained relatively stable, however, recent high prices for benzene, a primary raw material for MDI, have squeezed MDI margins globally. In Europe over the past ten years, these margins have tended to be higher on average but with slightly greater volatility due to occasional supply and demand imbalances. The volatility in margins has been highest in Asia, primarily due to the region's status as a net importer of MDI. As a result, Asia has excess supply in times of surplus in the Americas and Europe and shortage in times of strong global demand. Historically, oversupply of MDI has been rapidly absorbed due to the high growth rate of MDI consumption.
TDI
The TDI market generally grows at a rate consistent with GDP. The four largest TDI producers supply approximately 60% of global TDI demand, according to Nexant ChemSystems. The consumers of TDI consist primarily of numerous manufacturers of flexible foam blocks sold for use as furniture cushions and mattresses. Flexible foam is typically the first polyurethane market to become established in developing countries, and, as a result, development of TDI demand typically precedes MDI demand.
TPU
TPU is a high quality material with unique qualities such as durability, flexibility, strength, abrasion-resistance, shock absorbency and chemical resistance. We can tailor the performance characteristics of TPU to meet the specific requirements of our customers, such as for use in injection molding and components for the automotive and footwear industries. It is also extruded into films and profiles and finds a wide variety of applications in the coatings, adhesives, sealants and elastomers ("CASE") markets.
10
Polyols
Polyols are reacted with isocyanates, primarily MDI and TDI, to produce finished polyurethane products. In the United States, approximately 77% of all polyols produced are used in polyurethane foam applications, according to Nexant ChemSystems. Approximately two-thirds of the polyols used in polyurethane applications are processed with TDI to produce flexible foam blocks and the remaining one-third is processed in various applications that meet the specific needs of individual customers. The creation of a broad spectrum of polyurethane products is made possible through the different combinations of the various polyols with MDI, TDI and other isocyanates. The market for specialty polyols that are reacted with MDI has been growing at approximately the same rate at which MDI consumption has been growing. We believe that the growth of commodity polyols demand has paralleled the growth of global GDP.
Aniline
Aniline is an intermediate chemical used primarily as a raw material to manufacture MDI. Approximately 80% of all aniline produced is consumed by MDI producers, while the remaining 20% is consumed by synthetic rubber and dye producers. According to Nexant ChemSystems, global capacity for aniline was approximately 7.1 billion pounds per year in 2003. Generally, most aniline produced is either consumed downstream by the producers of the aniline or is sold to third parties under long-term supply contracts. The lack of a significant spot market for aniline means that in order to remain competitive, MDI manufacturers must either be integrated with an aniline manufacturing facility or have a long-term cost-competitive aniline supply contract.
PO
Demand for PO depends largely on overall economic demand, especially that of consumer durables. Consumption of PO in the United States represents approximately one third of global consumption. According to Nexant ChemSystems, U.S. consumption of PO was approximately 4.0 billion pounds in 2003, growing from 2.5 billion pounds in 1990, which represents a 3.7% compound annual growth rate. According to Nexant ChemSystems, the following chart illustrates the primary end markets and applications for PO, and their respective percentages of total PO consumption:
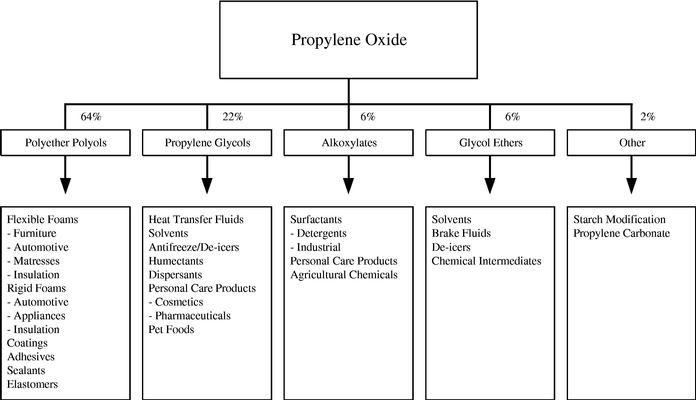
Source: Nexant ChemSystems
11
Two U.S. producers, Lyondell Chemical Company ("Lyondell") and Dow Chemical, account for approximately 90% of North American PO production. We believe that Dow Chemical consumes approximately 70% of their North American PO production in their North American downstream operations, and that approximately 50% of Lyondell's North American PO production is consumed internally or sold to Bayer, which acquired Lyondell's polyols business.
MTBE
We currently use our entire production of tertiary butyl alcohol ("TBA"), a co-product of our PO production process, to produce MTBE. MTBE is an oxygenate that is blended with gasoline to reduce harmful vehicle emissions and to enhance the octane rating of gasoline. Historically, the refining industry utilized tetra ethyl lead as the primary additive to increase the octane rating of gasoline until health concerns resulted in the removal of tetra ethyl lead from gasoline. This led to the increasing use of MTBE as a component in gasoline during the 1980s. U.S. consumption of MTBE grew at a compound annual rate of 15.2% in the 1990s due primarily to the implementation of the Clean Air Act Amendments of 1990 (the "Clean Air Act") which mandated the use of oxygenates to improve gasoline quality and thereby reduce carbon monoxide and hydrocarbon emissions from automobile engines. Some regions of the United States have adopted this oxygenate requirement to improve air quality even though they may not be mandated to do so by the Clean Air Act. While this trend has further increased MTBE consumption, the use of MTBE is controversial in the United States and may be substantially curtailed or eliminated in the future by legislation or regulatory action. See "—MTBE Developments" below.
Polyurethanes—Sales and Marketing
We manage a global sales force at 40 locations with a presence in 30 countries, which sells our polyurethane products to over 2,000 customers in 94 countries. Our sales and technical resources are organized to support major regional markets, as well as key end-use markets which require a more global approach. These key end-use markets include the appliance, automotive, footwear, furniture and CASE industries.
Approximately 50% of our polyurethane chemicals sales are in the form of "systems" in which we provide the total isocyanate and polyol formulation to our customers in a ready-to-use form. Our ability to supply polyurethane systems is a critical factor in our overall strategy to offer comprehensive product solutions to our customers. We have strategically located our polyol blending facilities, commonly referred to in the chemicals industry as "systems houses," close to our customers, enabling us to focus on customer support and technical service. We believe this customer support and technical service system contributes to customer retention and also provides opportunities for identifying further product and service needs of customers.
We believe that the extensive market knowledge and industry experience of our sales executives and technical experts, in combination with our strong emphasis on customer relationships, have facilitated our ability to establish and maintain long-term customer contracts. Due to the specialized nature of our markets, our sales force must possess technical knowledge of our products and their applications. Our strategy is to continue to increase sales to existing customers and to attract new customers by providing quality products, reliable supply, competitive prices and superior customer service at the lowest cost.
Based on current production levels, we have entered into long-term contracts to sell 45% of our PO to a customer through 2007. The balance of our PO is used internally and by our affiliates or sold to a number of industrial accounts. Other contracts provide for the sale of our MTBE production to business units of Chevron Texaco Corp. ("ChevronTexaco") and BP p.l.c. ("BP"). More than 70% of our annual MTBE production of our Port Neches, Texas, PO/MTBE plant is committed to ChevronTexaco and BP, with our contract with ChevronTexaco expiring in 2007. In addition, over 40% of our current annual PG production is sold pursuant to long-term contracts.
12
Polyurethanes—Manufacturing and Operations
Our primary polyurethanes facilities are located at Geismar, Louisiana, Port Neches, Texas, Rozenburg, Netherlands and Wilton, U.K. The following chart provides information regarding the annual capacities of some of our key facilities:
| |
MDI |
TDI |
Polyols |
TPU |
Aniline |
Nitrobenzene |
PO |
PG |
MTBE |
|||||||||
|---|---|---|---|---|---|---|---|---|---|---|---|---|---|---|---|---|---|---|
| |
(pounds in millions) |
(gallons in millions) |
||||||||||||||||
| Geismar, Louisiana(1) | 860 | 90 | 160 | 830 | (2) | 1,200 | (2) | |||||||||||
| Osnabrück, Germany | 20 | 30 | ||||||||||||||||
| Port Neches, Texas | 525 | 130 | 260 | |||||||||||||||
| Ringwood, Illinois | 20 | |||||||||||||||||
| Rozenburg, Netherlands | 660 | 120 | ||||||||||||||||
| Wilton, U.K. | 660 | 810 | ||||||||||||||||
| Total | 1,520 | 90 | 300 | 50 | 1,490 | 2,010 | 525 | 130 | 260 | |||||||||
Since 1996, over $600 million has been invested to improve and expand our MDI production capabilities through the rationalization of older, less efficient facilities and the modernization of newer facilities. We expect to pursue future plant expansions and capacity modification projects when justified by market conditions.
In addition to MDI, we produce TDI and polyols at our Geismar facility and polyols and polyol blends at our Rozenburg facility. We manufacture TDI and polyols primarily to support our MDI customers' requirements.
We use a proprietary manufacturing process to manufacture PO. We own or license all technology, know-how and patents developed and utilized at our PO facility. Our process reacts isobutane and oxygen in proprietary oxidation (peroxidation) reactors, thereby forming tertiary butyl hydroperoxide ("TBHP") and TBA which are further processed into PO and MTBE, respectively. Because our PO production process is less expensive relative to other technologies and allows all of our PO co-products to be processed into saleable or useable materials, we believe that our PO production technology possesses several distinct advantages over its alternatives.
Rubicon Joint Venture
We are a 50% joint venture owner, along with Crompton Corp. ("Crompton"), of Rubicon, LLC ("Rubicon"), which owns aniline, nitrobenzene and diphenylamine ("DPA") manufacturing facilities in Geismar, Louisiana. In addition to operating our 100% owned MDI, TDI and polyol facilities at Geismar, Rubicon also operates the joint venture's owned aniline, nitrobenzene and DPA facilities and is responsible for providing other auxiliary services to the entire Geismar complex. We are entitled to approximately 80% of the nitrobenzene and aniline production capacity of Rubicon, and Crompton is entitled to 100% of the DPA production. As a result of this joint venture, we are able to achieve greater scale and lower costs for our products than we would otherwise have been able to obtain.
Chinese MDI Joint Venture
In January 2003, we entered into two related joint venture agreements to build MDI production facilities near Shanghai, China. The Manufacturing JV with BASF and three Chinese chemical companies will build three plants to manufacture MNB, aniline, and crude MDI. We own 35% of the
13
Manufacturing JV. The Splitting JV with Shanghai Chlor-Alkali Chemical Company, Ltd. will build a plant to manufacture pure MDI, polymeric MDI and MDI variants. We own 70% of the Splitting JV. A feasibility study for the project has been approved by the appropriate Chinese authorities, preliminary engineering work has commenced and a business license was issued on March 7, 2003.
The project will be funded by a combination of equity invested by the joint venture partners and borrowed funds. We anticipate that our investment in the joint ventures and other related capital costs will be approximately $85 million. On November 13, 2003, the joint venture partners announced their intention to increase the production capacity of the Manufacturing JV from 160,000 to 240,000 metric tons per year. This change increased our expected share of the capital cost by approximately $10 million, from $75 million to $85 million.
On September 19, 2003, the joint ventures obtained secured financing for the construction of the production facilities. The Manufacturing JV obtained term loans for the construction of its plant in the maximum principal amount of approximately $218.4 million, a working capital credit line in the amount of approximately $4.5 million, and a facility for funding VAT payments in the amount of approximately $1.5 million. The Splitting JV obtained term loans for the construction of its plant in the maximum principal amount of approximately $82.4 million, a working capital credit line in the amount of approximately $35.1 million, and a facility for funding VAT payments in the amount of approximately $0.6 million. The financing is non-recourse to our Company, but will be guaranteed during the construction phase by affiliates of the joint venture, including Huntsman Holdings. Huntsman Holdings unconditionally guarantees 35% of any amounts due and unpaid by the Manufacturing JV under the loans described above (except for the VAT facility which is not guaranteed), and 70% of any amounts due and unpaid by the Splitting JV under the loans described above (except for the VAT facility which is not guaranteed). Huntsman Holdings' guarantees remain in effect until the relevant joint venture has (i) commenced production at least 70% of capacity for at least 30 days, and (ii) achieved a debt service cover ratio of at least 1:1.
Polyurethanes—Raw Materials
The primary raw materials for polyurethane chemicals are benzene and PO. Benzene is a widely available commodity that is the primary feedstock for the production of MDI. Approximately one-third of the raw material costs of MDI is attributable to the cost of benzene. Our integration with our supply of benzene produced in our Base Chemicals business, nitrobenzene and aniline provides us with a competitively priced supply of feedstocks and reduces our exposure to supply interruption.
A major cost in the production of polyols is attributable to the costs of PO. We believe that the integration of our PO business with our polyurethane chemicals business gives us access to a competitively priced, strategic source of PO and the opportunity to further expand into the polyol market. The primary raw materials used in our PO production process are butane/isobutane, propylene, methanol and oxygen, which accounted for 56%, 24%, 17% and 2%, respectively, of total raw material costs in 2003. We purchase our raw materials primarily under long-term contracts. While most of these feedstocks are commodity materials generally available to us from a wide variety of suppliers at competitive prices in the spot market, all the propylene used in the production of our PO is produced by our 60% shareholder, Huntsman LLC, and delivered through a pipeline connected to our PO facility.
Polyurethanes—Competition
Competitors in the polyurethane chemicals business include leading worldwide chemical companies such as BASF, Bayer, Dow Chemical and Lyondell. While these competitors produce various types and quantities of polyurethane chemicals, we focus on MDI and MDI-based polyurethane systems. We compete based on technological innovation, technical assistance, customer service, product reliability
14
and price. In addition, our polyurethane chemicals business also differentiates itself from its competition in the MDI market in two ways: (1) where price is the dominant element of competition, our polyurethane chemicals business differentiates itself by its high level of customer support including cooperation on technical and safety matters; and (2) elsewhere, we compete on the basis of product performance and our ability to react to customer needs, with the specific aim of obtaining new business through the solution of customer problems. Nearly all the North American PO production capacity is located in the U.S. and controlled by three producers, Lyondell, Dow Chemical and us. We compete based on price, product performance and service.
Polyurethanes—MTBE Developments
The use of MTBE is controversial in the United States and elsewhere, and may be substantially curtailed or eliminated in the future by legislation or regulatory action. The presence of MTBE in some groundwater supplies in California and other states (primarily due to gasoline leaking from underground storage tanks) and in surface water (primarily from recreational watercraft) has led to public concern about MTBE's potential to contaminate drinking water supplies. Heightened public awareness regarding this issue has resulted in state, federal and foreign initiatives to rescind the federal oxygenate requirements for reformulated gasoline or restrict or prohibit the use of MTBE in particular. For example, the California Air Resources Board adopted regulations that prohibit the addition of MTBE to gasoline as of January 1, 2004. Certain other states have also taken actions to restrict or eliminate the future use of MTBE. In connection with its ban, the State of California requested that the U.S. Environmental Protection Agency (the "EPA") waive the federal oxygenated fuels requirements of the federal Clean Air Act for gasoline sold in California. The EPA denied the State's request on June 12, 2001. Certain of the state bans, including California's ban, have been challenged in court as unconstitutional (in light of the Clean Air Act). On June 4, 2003, a federal court of appeals rejected such a challenge to California's ban, ruling that the ban is not preempted by the Clean Air Act.
Bills have been introduced in the U.S. Congress to curtail or eliminate the oxygenated fuels requirements in the Clean Air Act, or curtail MTBE use. To date, no such legislation has become law, but such legislation is being considered by Congress and could result in a federal ban on the use of MTBE in gasoline. In addition, on March 20, 2000, the EPA announced its intention, through an advanced notice of proposed rulemaking, to phase out the use of MTBE under authority of the federal Toxic Substances Control Act. In its notice, the EPA also called on the U.S. Congress to restrict the use of MTBE under the Clean Air Act.
In Europe, the European Union ("EU") issued a final risk assessment report on MTBE on September 20, 2002. While no ban of MTBE was recommended, several risk reduction measures relating to storage and handling of MTBE-containing fuel were recommended. Separate from EU action, Denmark entered into a voluntary agreement with refiners to reduce the sale of MTBE in Denmark. Under the agreement, use of MTBE in 92- and 95-octane gasoline in Denmark ceased May 1, 2002; however, MTBE is still an additive in 98-octane gasoline sold in 100 selected service stations in Denmark.
Any phase-out or other future regulation of MTBE in other states, nationally or internationally may result in a significant reduction in, or elimination of, demand for our MTBE and result in a material loss in revenues or material costs or expenditures. In the event that there should be a phase-out of MTBE in the United States, we believe we will be able to export MTBE to Europe or elsewhere or use our co-product TBA to produce saleable products other than MTBE. We believe that our low production costs at the PO/MTBE facility will put us in a favorable position relative to other higher cost sources (primarily, on-purpose manufacturing). If we opt to produce products other than MTBE, necessary modifications to our facilities may require significant capital expenditures and the sale of the other products may produce a materially lower level of cash flow than the sale of MTBE.
15
In addition, while we have not been named as a defendant in any litigation concerning the environmental effects of MTBE, we cannot provide assurances that we will not be involved in any such litigation or that such litigation will not have a material adverse effect on our business, financial condition, results of operations or cash flows. In 2003, the U.S. House of Representatives passed a version of an energy bill that contained limited liability protection for producers of MTBE. The Senate's version of the bill did not have liability protection. The issue was one of the reasons that a compromise energy bill was not passed. Whether a compromise will be reached on this legislation in 2004, and whether any compromise will provide liability protection for producers, are unknown. In any event, the liability protection provision in the House bill applied only to defective product claims; it would not preclude other types of lawsuits. See "Item 7—Management's Discussion and Analysis of Financial Condition and Results of Operations—Cautionary Statement for Forward Looking Information—Pending or future litigation or legislative initiatives related to MTBE may subject us or our products to environmental liability or materially adversely affect our sales and costs."
Performance Products
Performance Products—General
Our Performance Products include surfactants and amines.
We have the capacity to produce approximately 1.6 billion pounds of surfactant products annually at our six facilities located in Europe. Our surfactants business is a leading global manufacturer of nonionic, anionic, cationic and amphotenic surfactants products and is characterized by its breadth of product offering and market coverage. Our surfactant products are primarily used in consumer detergent and industrial cleaning applications. In addition, we manufacture and market a diversified range of mild surfactants and specialty formulations for use in shampoos and other personal care applications. We are also a leading European producer of powder and liquid laundry detergents and other cleaners. In addition, we offer a wide range of surfactants and formulated specialty products for use in various industrial applications, such as leather and textile treatments, foundry and construction products, agrochemicals, polymers and coatings.
We have the capacity to produce approximately 160 million pounds of ethyleneamines annually at our facilities located at Freeport, Texas and Dow Chemical's facilities located at Terneuzen, Netherlands. When we acquired our ethyleneamines business, we acquired a long-term supply arrangement for up to 50% of the existing production capacity of Dow Chemical's ethyleneamines plant in Terneuzen, Netherlands. Our ethyleneamines are used in a wide variety of consumer and industrial applications, including lube oil additives, epoxy hardeners, wet strength resins, chelating agents and fungicides.
Performance Products—Industry Overview
Surfactants
Surfactants or "surface active agents" are substances which combine a water-soluble component with a water insoluble component in the same molecule. While surfactants are most commonly used for their detergency in cleaning applications, they are also valued for their emulsification, foaming, dispersing, penetrating and wetting properties in a variety of industries. While growth in demand for surfactants is highly correlated with GDP due to its strong links with the household cleaning and general industrial markets, certain segments of the surfactants market, including personal care, are expected to grow faster than GDP.
16
The table below identifies the major surfactant product groups that we produce and some common applications.
| Product Group |
Application |
|
|---|---|---|
Alkoxylates |
household detergents industrial cleaners shampoos polymerization additives |
|
Sulfonates/Sulfates |
powdered detergents liquid detergents dishwashing liquids industrial cleaners emulsion polymerization concrete superplasticizers gypsum wallboard agricultural adjuvants for herbicides |
|
Esters and Derivatives |
shampoo body wash other personal care products textile and leather treatment |
|
Nitrogen Derivatives |
bleach thickeners shampoo fabric conditioners other personal care products and applications |
|
Formulated Blends |
household detergents textile and leather treatment personal care products and applications foundry catalysts concrete additives pharmaceutical intermediates |
|
EO/PO Block Co-Polymers |
automatic dishwasher detergents |
According to Nexant ChemSystems, global demand in 2003 for surfactants was approximately 24 billion pounds. Demand growth for surfactants is viewed as being relatively stable and exhibits little cyclicality. The main consumer product applications for surfactants can demand new formulations with unproved performance characteristics which may require further development, and as a result life cycles for these consumer end products can often be quite short. This affords considerable opportunity for innovative surfactants manufacturers to provide surfactants and blends with differentiated specifications and properties. For basic surfactants, pricing tends to have a strong relationship to underlying raw material prices and usually lags petrochemical price movements.
Amines
Amines broadly refer to the family of intermediate chemicals that are produced by reacting ammonia with various ethylene and propylene derivatives. Generally, amines are valued for their properties such as reactivity, emulsification, dispersancy, detergency, and as solvents or corrosion inhibiting agents. Similar to surfactants, growth in demand for amines is highly correlated with GDP due to its strong links to general industrial and consumer products markets. However, certain segments of the amines market, including polyetheramines and carbonates, have grown at rates well in excess of
17
GDP due to new product development, technical innovation, and substitution and replacement of competing products.
As amines are generally sold based upon the performance characteristics that they provide to customer-specific end use applications, pricing for amines tends to be stable and does not generally fluctuate with movements in underlying raw materials.
| Product |
Applications |
|
|---|---|---|
| Ethyleneamines | lube oil additives epoxy hardeners wet strength resins chelating agents fungicides |
The primary raw materials for ethyleneamines are ethylene dichloride and caustic soda. We have entered into long-term arrangements for the supply of ethylene dichloride and caustic soda from Dow, which produces these raw materials at facilities that are in close proximity to our Freeport, Texas manufacturing facility.
Our Performance Products business accounted for 13%, 13% and 10% of net sales in 2003, 2002 and 2001, respectively.
Performance Products—Sales and Marketing
We sell our products to customers globally through a commercial organization which has extensive market knowledge, lengthy industry experience and long-standing customer relationships. Our sales force is organized into specialized teams tailored to each market segment's specific needs, thereby enhancing customer service.
We also provide extensive pre- and post-sales technical service support to our customers. Our technical service professionals bring sophisticated skills to our customers and are well regarded within their field of expertise. Moreover, these professionals help tailor the application of our products to meet our customers' unique needs and interact closely with our cross functional business teams.
In addition to direct sales efforts, we also sell some of our products through a network of distributors. In most cases, sales through these distributors have a higher profit margin than direct sales to end users. Distributors typically promote our products to smaller end use customers who cannot cost-effectively be served by our direct sales force.
Performance Products—Manufacturing and Operations
We have the capacity to produce approximately 1.6 billion pounds of surfactant products annually at our six facilities located in the U.K. (at Whitehaven), France (at Lavera and St. Mihiel), Spain (at Barcelona), and Italy (at Castiglione and Patrica), and a research facility located in the U.K. (at Oldbury). Our surfactants facilities are well located in Europe, with broad capabilities in conversion, sulfonation and ethoxylation. The surfactants facilities taken as a whole have a competitive cost base and use modern production tools that allow for flexibility in production capabilities and technical innovation. We are moving forward with restructuring our Whitehaven, UK facility with a goal of reducing the operating cost of the facility. In connection with this restructuring, we have announced the closure of our alcohol production facility and certain other production units at Whitehaven and have recorded a $20.1 million charge to reflect the related asset impairment charge of $11.4 million and $8.7 million of our severance costs, $8.6 million of which has been paid in 2003. We also recorded a $2.0 million charge in respect of severance costs arising from the closure of an administrative office in London, UK, the rationalization of our surfactants technical center in Oldbury, UK and the
18
restructuring of our Spanish facility in Barcelona, Spain. In March 2004, we announced an additional restructuring at our Whitehaven, UK facility related to the relocation and consolidation of various plants, equipment and workshop facilities, and the development of a centralized control room to help improve the integrity and productivity of the main site assets. The total restructuring costs associated with this project are expected to be $11.1 million and include an asset write down of approximately $5.0 million and a reduction in workforce of approximately 45 employees.
We have the capacity to produce approximately 160 million pounds of ethyleneamines annually at our facilities located at Freeport, Texas and Dow Chemical's facilities located at Terneuzen, Netherlands. When we acquired our ethyleneamines business, we acquired a long-term supply arrangement for up to 50% of the existing production capacity of Dow Chemical's ethyleneamines plant in Terneuzen, Netherlands.
Performance Products—Competition
There are numerous surfactants producers in Europe and worldwide. Our main competitors include worldwide leading chemical companies such as Sasol Limited, BASF, Shell Chemical Company ("Shell Chemical"), The Cognis Group, Clariant Ltd, AKZO Nobel N.V. ("AKZO Nobel"), Dow Chemical, as well as various smaller or more local competitors. We compete on the basis of price with respect to our basic surfactant product offering and, in addition to price, on the basis of performance and service with respect to our specialty and blended surfactant products. Our main competitors in ethyleneamines include BASF, Dow Chemical and AKZO Nobel.
Pigments
Pigments—General
Our Pigments business, which operates under the trade name "Tioxide," is among the largest producers of TiO2 in the world, with an estimated 12% market share, according to IBMA in research we commissioned, and has the largest production capacity for TiO2 in Europe. TiO2 is a white pigment used to impart whiteness, brightness and opacity to products such as paints, plastics, paper, printing inks, synthetic fibers and ceramics. In addition to its optical properties, TiO2 possesses traits such as stability, durability and non-toxicity, making it superior to other white pigments. According to IBMA, global consumption of TiO2 was approximately 4.1 million tonnes in 2003, growing from 3.0 million tonnes in 1992, representing a 2.8% compound annual growth rate.
We offer an extensive range of products that are sold worldwide to over 3,000 customers in all major TiO2 end markets and geographic regions. The geographic diversity of our manufacturing facilities allows our Pigments business to service local customers, as well as global customers that require delivery to more than one location. Our Pigments business has an aggregate annual nameplate capacity of approximately 596,000 tonnes at our eight production facilities. Five of our TiO2 manufacturing plants are located in Europe, one is in North America, one is in Asia, and one is in South Africa. Our North American operation consists of a 50% interest in a manufacturing joint venture with a subsidiary of NL Industries, Inc. ("NL Industries"), Kronos Worldwide, Inc. ("Kronos Worldwide").
In late 2002 we commissioned a new TiO2 manufacturing plant at our Greatham, U.K. facility in 2002. This new plant allowed us to close an older, higher cost plant located at Greatham and increased our annual production capacity of the facility to 100,000 tonnes of chloride-based TiO2.
We are focused on cost control and productivity, and we believe our cost position makes us an effective competitor in the global TiO2 market. Between 1996 and 2000, we completed a comprehensive cost reduction program that eliminated approximately $120 million of annualized costs. We are
19
currently implementing a series of new cost rationalization initiatives which are targeted to achieve additional savings of $80 million by the end of 2005.
Our Pigments business accounted for 19% of our net sales in each of 2003, 2002 and 2001.
Pigments—Industry Overview
Global consumption of TiO2 was 4.1 million tonnes in 2003 according to IBMA. Although short-term influences such as customer and producer stocking and de-stocking activities in response to changes in capacity utilization and price may distort this trend, over the long-term, GDP growth is the primary underlying factor influencing growth in TiO2 demand. The TiO2 industry experiences some seasonality in its sales because paint sales generally peak during the spring and summer months in the northern hemisphere, resulting in greater sales volumes during the first half of the year.
The global TiO2 market is characterized by a small number of large global producers. The TiO2 industry currently has five major producers (E.I. duPont deNemours and Company ("DuPont"), Millennium Chemicals, Inc. ("Millennium Chemicals"), our Company, Kerr-McGee Corporation ("Kerr-McGee") and NL Industries), which account for approximately 80% of the global market share, according to IBMA in a study we commissioned. No producer has announced greenfield TiO2 capacity in the last few years. Based upon current price levels and the long lead times for planning, governmental approvals and construction, additional greenfield capacity is not expected in the near future. According to IBMA, prices of TiO2 are expected to be positively affected by limited investment in new capacity.
There are two manufacturing processes for the production of TiO2, the sulfate process and the chloride process. Most recent capacity additions have employed the chloride process technology and, currently, the chloride process accounts for approximately 64% of global production capacity according to IBMA. However, the global distribution of sulfate and chloride-based TiO2 capacity varies by region, with the sulfate process being predominant in Europe, our primary market. The chloride process is the predominant process used in North America and both processes are used in Asia. While most end-use applications can use pigments produced by either process, market preferences typically favor products that are locally available.
Pigments—Sales and Marketing
Approximately 85% of our TiO2 sales are made through our direct sales and technical services network, enabling us to cooperate more closely with our customers and to respond to our increasingly global customer base. Our concentrated sales effort and local manufacturing presence have allowed us to achieve leading market shares in a number of the countries where we manufacture TiO2.
In addition, we have focused on marketing products to higher growth industries. For example, we believe that our Pigments business is well-positioned to benefit from the projected growth in the plastics sector, which, according to IBMA, is expected to grow faster than the overall TiO2 market over the next several years. The table below summarizes the major end markets for our Pigments products:
| End Markets |
% of 2003 Sales Volume |
||
|---|---|---|---|
| Paints and Coatings | 59 | % | |
| Plastics | 31 | % | |
| Inks | 5 | % | |
| Other | 5 | % |
20
Pigments—Manufacturing and Operations
Our Pigments business has eight manufacturing sites in seven countries with a total nameplate capacity of 596,000 tonnes per year. Approximately 73% of our TiO2 capacity is located in Western Europe. The following table presents information regarding our TiO2 facilities:
| Region |
Site |
Annual Capacity |
Process |
|||
|---|---|---|---|---|---|---|
| |
|
(tonnes) |
|
|||
| Western Europe | Calais, France | 100,000 | Sulfate | |||
| Greatham, U.K. | 100,000 | Chloride | ||||
| Grimsby, U.K. | 80,000 | Sulfate | ||||
| Huelva, Spain | 80,000 | Sulfate | ||||
| Scarlino, Italy | 80,000 | Sulfate | ||||
North America |
Lake Charles, Louisiana(1) |
60,000 |
Chloride |
|||
Asia |
Teluk Kalung, Malaysia |
56,000 |
Sulfate |
|||
Southern Africa |
Umbogintwini, South Africa |
40,000 |
Sulfate |
|||
| 596,000 | ||||||
Joint Ventures
We own a 50% interest in a manufacturing joint venture located in Lake Charles, Louisiana. The remaining 50% interest is held by our joint venture partner Kronos Louisiana, Inc. ("Kronos"), a subsidiary of Kronos Worldwide. We share production offtake and operating costs of the plant equally with Kronos, though we market our share of the production independently. The operations of the joint venture are under the direction of a supervisory committee on which each partner has equal representation.
Raw Materials
The primary raw materials used to produce TiO2 are titanium-bearing ores. There are a limited number of ore suppliers and we purchase ore under long-term supply contracts. The cost of titanium-bearing ores has been relatively stable in comparison to TiO2 prices. Titanium-bearing ore represents approximately 40% of TiO2 pigment production costs.
TiO2 producers extract titanium from ores and process it into pigmentary TiO2 using either the chloride or sulfate process. Once an intermediate TiO2 pigment has been produced, it is "finished" into a product with specific performance characteristics for particular end-use applications. The finishing process is common to both the sulfate and chloride processes and is a major determinant of the final product's performance characteristics.
The sulfate process generally uses less-refined ores that are cheaper to purchase but produce more co-product than the chloride process. Co-products from both processes require treatment prior to disposal in order to comply with environmental regulations. In order to reduce our disposal costs and to increase our cost competitiveness, we have developed and marketed the co-products of our Pigments business. We now sell over 50% of the co-products generated by our business.
21
We continuously evaluate the effectiveness of all of our manufacturing facilities in serving our markets. We are currently engaged in a review of our cost position and the market effectiveness of our TiO2 manufacturing facilities. In connection with this review, we are giving consideration to idling excess production capacity, representing up to 10% of our annual nameplate capacity for the production of TiO2. This action, if taken, could result in significant annual cost savings and could involve a material, but as of yet, undetermined non-cash charge for the write-down of the assets in our Pigments segment and involve the payment of cash restructuring costs of up to $20 million in 2004 and 2005.
Pigments—Competition
The global markets in which our Pigments business operates are highly competitive. The primary factors of competition are price, product quality and service. The major global producers against whom we compete are DuPont, Millennium Chemicals, Kerr-McGee and Kronos Worldwide. We believe that our competitive production costs, combined with our presence in numerous local markets, makes us an effective competitor in the global market, particularly with respect to those global customers demanding presence in the various regions in which they conduct business.
Base Chemicals
Base Chemicals—General
We are a highly integrated European olefins and aromatics producer. Olefins, principally ethylene and propylene, are the largest volume basic petrochemicals and are the key building blocks from which many other chemicals are made. For example, olefins are used to manufacture most plastics, resins, adhesives, synthetic rubber and surfactants that are used in a variety of end-use applications. Aromatics, including paraxylene, cyclohexane and benzene, are basic petrochemicals used in the manufacture of polyurethane chemicals, nylon, polyester fibers, synthetic rubber and a variety of plastics.
Olefins
Our olefins facility at Wilton, U.K. is one of Europe's largest single-site and lowest cost olefins facilities, according to Nexant ChemSystems in a study we commissioned. Our Wilton facility has the capacity to produce approximately 1.9 billion pounds of ethylene, 880 million pounds of propylene and 225 million pounds of butadiene per year. The Wilton olefins facility benefits from its feedstock flexibility and superior logistics, which allows for processing of naphthas, condensates and natural gas liquids ("NGLs").
Aromatics
We produce aromatics in Europe at our two integrated manufacturing facilities located in Wilton, U.K. and North Tees, U.K. According to Nexant ChemSystems in a study we commissioned, we are a leading European producer of cyclohexane with 725 million pounds of annual capacity, a leading producer of paraxylene with 800 million pounds of annual capacity and are among Europe's larger producers of benzene with 1,150 million pounds of annual capacity. We use most of the benzene produced by our aromatics business internally in the production of nitrobenzene for our Polyurethanes business and for the production of cyclohexane. The balance of our aromatics products are sold to several key customers.
Base Chemicals—Industry Overview
Petrochemical markets are essentially global commodity markets. However, the olefins market is subject to some regional price differences due to the more limited inter-regional trade resulting from
22
the high costs of product transportation. The global petrochemicals market is cyclical and is subject to pricing swings due to supply and demand imbalances, feedstock prices (primarily driven by crude oil prices) and general economic conditions.
According to Nexant ChemSystems, the petrochemical industry is at or near its cyclical trough following a period of oversupply in the last few years and supply and demand characteristics are currently expected to improve in coming years, which should result in improved performance.
As shown in the following table, ethylene is the largest petrochemicals market and paraxylene has been the fastest growing:
| Product |
2003 Global Market size |
Historic Growth, (1992-2003) |
Markets |
Applications |
||||
|---|---|---|---|---|---|---|---|---|
| |
(Billions of Pounds) |
|
|
|
||||
| Ethylene | 246 | 5.7 | % | polyethylene, ethylene oxide, polyvinyl chloride, alpha olefins, styrene | packaging materials, plastics, housewares, beverage containers, personal care | |||
Propylene |
125 |
5.1 |
% |
polypropylene, propylene oxide, acrylonitrile, isopropanol |
clothing fibers, plastics, automotive parts, foams for bedding and furniture |
|||
Butadiene |
20 |
3.3 |
% |
SBR rubber, polybutadiene, SB latex |
automotive, carpet |
|||
Benzene |
69 |
3.0 |
% |
polyurethanes, polystyrene cyclohexane, cumene |
appliances, automotive components, detergents, personal care, packaging materials, carpet |
|||
Paraxylene |
44 |
8.5 |
% |
polyester, purified terephthalic acid ("PTA") |
fibers, textiles, beverage containers |
|||
Cyclohexane |
8.8 |
2.5 |
% |
nylon 6, nylon 6,6 |
fibers, resins |
Source: Nexant ChemSystems
The olefins markets in Western Europe are supplied by numerous producers, none of whom has a dominant position in terms of its share of production capacity. Global ethylene consumption in 2003 was 246 billion pounds, according to Nexant ChemSystems, representing an average industry operating rate of 86%. Global propylene consumption in 2003 is estimated at 125 billion pounds, representing an average industry operating rate of 81%. The top three Western European producers of ethylene are AtoFina, Dow Chemical and EniChem.
Like the olefins market, the aromatics market, which is primarily comprised of cyclohexane, benzene and paraxylene, is characterized by several major producers, including, according to Nexant ChemSystems, Dow Chemical, AtoFina (the chemicals branch of TotalFina Elf S.A.) ("AtoFina"), Shell Chemical, EniChem, ExxonMobil Corporation ("ExxonMobil"), BASF and ChevronPhillips Chemical Company LP ("ChevronPhillips").
The benzene market is currently in a period of overcapacity. The increasing restrictions imposed by regulatory authorities on the aromatics content of gasoline in general, and the benzene content in
23
particular, have led to an increase in supply of aromatics in recent years. In 2003, global paraxylene demand grew by 7.7%, and after being nearly flat in 2000-2002, global capacity rose by 9.1%. As a result of these dynamics, according to Nexant ChemSystems, margins in the aromatics industry, particularly those in paraxylene, are currently expected to continue to exhibit characteristic cyclicality and recover from recently depressed cyclical lows in the next few years as polyester growth drives a rebalancing of supply and demand.
Base Chemicals—Sales and Marketing
In recent years, our sales and marketing efforts have focused on developing long-term contracts with customers to minimize our selling expenses and administration costs. In 2003, over 80% of our primary petrochemicals sales volume in Europe, was made under long-term contracts. In addition, we delivered over 65% of our petrochemical products volume in Europe in 2003 by pipeline.
Base Chemicals—Manufacturing and Operations
We produce olefins at our facility in Wilton, U.K. In addition, we own and operate integrated aromatics manufacturing facilities at Wilton U.K. and at North Tees, U.K. Information regarding these facilities is set forth below:
| Location |
Product |
Annual Capacity |
||
|---|---|---|---|---|
| |
|
(millions of pounds) |
||
| Wilton, U.K. | Ethylene Propylene Butadiene Paraxylene |
1,900 880 225 800 |
||
North Tees, U.K. |
Benzene Cyclohexane |
1,150 725 |
The Wilton olefins facility's flexible feedstock capability, which permits it to process naphtha, condensates and NGL feedstocks, allows us to take advantage of favorable feedstock prices arising from seasonal fluctuations or local availability. According to Nexant ChemSystems in research we commissioned, the Wilton olefins facility is one of Europe's most cost efficient olefins manufacturing facilities on a cash cost of production basis. In addition to our manufacturing operations, we also operate an extensive logistics operations infrastructure in North Tees, U.K. This infrastructure includes both above and below ground storage facilities, jetties and logistics services on the River Tees. These operations reduce our raw material costs by providing greater access and flexibility for obtaining feedstocks.
We believe that the cost position of our Wilton, U.K. olefins facility uniquely positions it to be the site of a polyethylene production facility. While we export approximately one-third of our ethylene production each year to continental Europe, incurring significant shipping and handling costs, the U.K. annually imports approximately 1.9 billion pounds of polyethylene. We believe this provides an opportunity to capitalize on the low-cost operating environment and extensive petrochemical infrastructure and logistics at Wilton, and we are engaged in a feasibility study with respect to the possible construction of a world-scale LDPE facility at our Wilton site. The potential LDPE facility under study would have the capacity to produce approximately 900 million pounds of LDPE annually and is estimated to cost $275 million to $300 million to construct. We have had preliminary discussions with governmental authorities concerning potential assistance and other matters in connection with the potential project, and we may seek the necessary board and other approvals for the project this year. If such approvals are granted this year, the facility could be operational in late 2006.
24
Base Chemicals—Raw Materials
Our North Tees facility, situated on the northeast coast of England, is near a substantial supply of oil, gas and chemical feedstocks. Due to our location at North Tees, we have the option to purchase feedstocks from a variety of sources. However, we have elected to procure the majority of our naphtha, condensates and NGLs from local producers as they have been the most economical sources. In order to secure the optimal mix of the required quality and type of feedstock for our petrochemical operations at fully competitive prices, we regularly engage in the purchase and sale of feedstocks and hedging activities.
Base Chemicals—Competition
The markets in which our Base Chemicals business operates are highly competitive. Our competitors in the olefins and aromatics business are frequently some of the world's largest chemical companies such as BP, Dow Chemical, ExxonMobil and Shell Chemical. The primary factors for competition in this business are price, service and reliability of supply. The technology used in these businesses is widely available and licensed.
For the years ended 2003, 2002 and 2001, we spent $49.4 million, $54.6 million and $62.5 million, respectively, on research and development of our products.
We support our business with a major commitment to R&D, technical services and process engineering improvement. Our primary R&D center is located in Everberg, Belgium. Other regional development/technical service centers are located in Billingham, England (Pigments); Auburn Hills, Michigan (Polyurethanes for the automotive industry); West Deptford, New Jersey, North Andover, Massachusetts; Shanghai, China; Deggendorf, Germany; Ternate, Italy (Polyurethanes); and Wilton, U.K. for process engineering support.
Proprietary protection of our processes, apparatuses, and other technology and inventions is important to our businesses. For our Polyurethanes business, we own more than 185 U.S. patents and pending U.S. patent applications (including provisionals), and more than 1,270 foreign counterparts, including both issued patents and pending patent applications. For our Pigments business, we have approximately 10 U.S. patents and pending patent applications, and approximately 105 foreign counterparts. For our Base Chemicals business, we own approximately 35 patents and pending applications (both U.S. and foreign). In our Performance Products business, we have approximately 50 U.S. patents and pending patent applications and approximately 485 foreign counterparts. While a presumption of validity exists with respect to issued U.S. patents, we cannot assure that any of our patents will not be challenged, invalidated, circumvented or rendered unenforceable. Furthermore, we cannot assure the issuance of any pending patent application, or that if patents do issue, that these patents will provide meaningful protection against competitors or against competitive technologies. Additionally, our competitors or other third parties may obtain patents that restrict or preclude our ability to lawfully produce or sell our products in a competitive manner.
We also rely upon unpatented proprietary know-how and continuing technological innovation and other trade secrets to develop and maintain our competitive position. There can be no assurance, however, that confidentiality agreements into which we enter and have entered will not be breached, that they will provide meaningful protection for our trade secrets or proprietary know-how, or that adequate remedies will be available in the event of an unauthorized use or disclosure of such trade secrets and know-how. In addition, there can be no assurance that others will not obtain knowledge of these trade secrets through independent development or other access by legal means.
25
In addition to our own patents and patent applications and proprietary trade secrets and know-how, we have entered into certain licensing arrangements that authorize us to use certain trade secrets, know-how and related technology and/or operate within the scope of certain patents owned by other entities. We also license and sub-license certain intellectual property rights to affiliates and to third parties. In connection with our transaction with HIH, ICI and Huntsman Specialty (under the terms of a technology transfer agreement and a PO/MTBE technology transfer agreement), we have licensed back to ICI and Huntsman LLC (on a non-exclusive basis) certain intellectual property rights for use in their respective retained businesses, and ICI and Huntsman LLC have each licensed certain retained intellectual property to us.
For our Polyurethanes businesses, we have brand names for a number of our products, and we own approximately 28 U.S. trademark registrations and applications for registration currently pending at the United States Patent and Trademark Office, and approximately 1,135 foreign counterparts, including both registrations and applications for registration. For our Pigments business, we have approximately 150 trademark registrations and pending applications, approximately 110 of which relate to the trademark "Tioxide." Our Base Chemicals business is not dependent on the use of trademarks. For our Performance Products business, we have brand names for a number of our products, and we own approximately 7 U.S. trademark registrations and applications for registration currently pending at the United States Patent and Trademark Office, and approximately 925 foreign counterparts, including both registrations and applications for registration. We have entered into a trademark license agreement with Huntsman Group Intellectual Property Holdings Corporation under which we have obtained the rights to use the trademark "Huntsman," subject to certain restrictions.
We employed approximately 6,300 people as of December 31, 2003. Approximately 88% of our employees work outside the United States. Approximately 50% of our employees are covered by collective bargaining agreements. In the ordinary course of our business we use the services of independent contractors. We believe that our relations with our employees are good.
Huntsman LLC provides management and administrative services to us and also provides operating services for our PO business. See "Item 13—Certain Relationships and Related Transactions."
Our operations are subject to extensive environmental laws and regulations concerning emissions to the air, discharges to surface and subsurface waters, and the generation, handling, storage, transportation, treatment and disposal of waste materials, as adopted by various governmental authorities in the jurisdictions in which we operate. We make every reasonable effort to remain in full compliance with existing governmental regulations. Accordingly, we may incur costs for capital improvements and general compliance under environmental laws, including costs to acquire, maintain and repair pollution control equipment. Our capital expenditures relating to environmental matters for the year ended December 31, 2003, were approximately $31 million. Capital costs relating to environmental matters in 2004 are expected to total approximately $40 million. A total of $17.0 million has been accrued related to environmental related liabilities as of December 31, 2003. Estimates of ultimate future environmental restoration and remediation costs are inherently imprecise due to currently unknown factors such as the magnitude of possible contamination, the timing and extent of such restoration and remediation, the determination of our liability in proportion to other parties, the extent to which such costs are recoverable from insurance, and the extent to which environmental laws and regulations may change in the future. However, it is not anticipated that any future costs, in excess of those that have been accrued by our Company, will be material to our results of operations or financial position as a result of compliance with current environmental laws and regulations.
26
Nevertheless, we cannot provide assurances that material capital expenditures beyond those currently anticipated will not be required under environmental laws. For more information see, "Item 7—Management's Discussion and Analysis of Financial Condition and Results of Operations—Environmental Matters."
We file annual, quarterly and current reports and other information with the Securities and Exchange Commission (the "SEC" or the "Commission"). You can inspect and copy these materials at the SEC's Public Reference Room at 450 Fifth Street, N.W., Washington, D.C. 20549. Copies of these materials may also be obtained by mail at prescribed rates from the SEC's Public Reference Room at the above address. You can obtain information about the Public Reference Room by calling the SEC at 1-800-SEC-0330. The SEC also maintains an Internet site that contains reports, proxy and information statements, and other information regarding issuers that file electronically with the SEC. The address of the SEC's Internet site is http://www.sec.gov.
We maintain an Internet web site at http://www.huntsman.com. We currently make our most recent annual or quarterly report available through our web site. In addition, copies of all our annual, quarterly and current reports are available through the SEC's web site or commercial services. We also provide mailed or electronic copies of our annual and quarterly reports to holders of our outstanding debt securities under the terms of our indentures, and we provide electronic or paper copies of our filings free of charge upon request.
We own or lease chemical manufacturing and research facilities in the locations indicated in the list below, which we currently believe are adequate for our short-term and anticipated long-term needs. We own or lease office space and storage facilities throughout the U.S. and many foreign countries. Our principal executive offices, which are leased from Huntsman LLC, are located at 500 Huntsman Way, Salt Lake City, Utah 84108. The following is a list of our material owned or leased properties where manufacturing, blending, research and main office facilities are located. For additional information, see "Item 1—Business—Operating Segments—Polyurethanes," "—Performance Products," "—Pigments" and "—Base Chemicals."
| Location |
Description of Facility |
|
|---|---|---|
| Geismar, Louisiana(3) | MDI, TDI, Nitrobenzene(3), Aniline(3) and Polyols Manufacturing Facilities | |
| Rozenburg, Netherlands(1) | MDI Manufacturing Facility, Polyols Manufacturing Facilities and Systems House | |
| Wilton, U.K. | Aniline and Nitrobenzene Manufacturing Facilities | |
| Peel, Canada(1) | Polyurethane Systems House | |
| West Deptford, New Jersey | Polyurethane Systems House, Research Facility and U.S. Regional Headquarters | |
| Auburn Hills, Michigan(1) | Polyurethane Office Space and Research Facility | |
| Deerpark, Australia(1) | Polyurethane Systems House | |
| Cartagena, Colombia | Polyurethane Systems House | |
| Deggendorf, Germany | Polyurethane Systems House | |
| Ternate, Italy | Polyurethane Systems House | |
| Shanghai, China(1) | Polyurethane Systems House | |
| Thane (Maharashtra), India(1) | Polyurethane Systems House | |
| Samuprakam, Thailand(1) | Polyurethane Systems House | |
| Kuan Yin, Taiwan(1) | Polyurethane Systems House | |
27
| Tlalnepantla, Mexico | Polyurethane Systems House | |
| Everberg, Belgium | Polyurethane Research Facility, Global Headquarters and European Headquarters | |
| Gateway West, Singapore(1) | Polyurethane Regional Headquarters | |
| North Andover, Massachusetts(1) | TPU Research Facility | |
| Ringwood, Illinois(1) | TPU Manufacturing Facility | |
| Osnabrück, Germany | TPU Manufacturing Facility | |
| Port Neches, Texas | PO Manufacturing Facility and MTBE Manufacturing Facility | |
| Wilton, U.K. | Olefins and Aromatics Manufacturing Facilities, Base Chemicals Headquarters | |
| North Tees, U.K.(1) | Aromatics Manufacturing Facility and Logistics/Storage Facility | |
| Teesport, U.K.(1) | Logistics/Storage Facility | |
| Saltholme, U.K. | Underground Cavity Storage Operations | |
| Grimsby, U.K. | TiO2 Manufacturing Facility | |
| Greatham, U.K. | TiO2 Manufacturing Facility | |
| Calais, France | TiO2 Manufacturing Facility | |
| Huelva, Spain | TiO2 Manufacturing Facility | |
| Scarlino, Italy | TiO2 Manufacturing Facility | |
| Teluk Kalung, Malaysia | TiO2 Manufacturing Facility | |
| Westlake, Louisiana(2) | TiO2 Manufacturing Facility | |
| Umbogintwini, South Africa | TiO2 Manufacturing Facility | |
| Billingham, U.K. | TiO2 Research and Technical Facility, and Pigments Headquarters | |
| Warrenville, Illinois | TiO2 and Polyurethanes Office Space and Research Facility | |
| Whitehaven, U.K. | Surfactants Manufacturing Facility | |
| St Mihiel, France | Surfactants Manufacturing Facility | |
| Lavera, France(1) | Surfactants Manufacturing Facility | |
| Castiglione, Italy | Surfactants Manufacturing Facility | |
| Patrica/Frosinane, Italy | Surfactants Manufacturing Facility | |
| Barcelona, Spain(1) | Surfactants Manufacturing Facility | |
| Oldbury, U.K(1) | Surfactants Research Facility | |
| Warley, U.K(1) | Surfactants Regional Headquarters | |
| Freeport, Texas | Amines Manufacturing Facility |
28
We are a party to various proceedings instituted by private plaintiffs, governmental authorities and others arising under provisions of applicable laws, including various environmental, products liability and other laws. Based in part on the indemnities provided to us by ICI in connection with their transfer of businesses to us and our insurance coverage, we do not believe that the outcome of any of these matters will have a material adverse effect on our financial condition or results of operations. See "Item 7—Management's Discussion and Analysis of Financial Condition and Results of Operations—Environmental Matters" for a discussion of environmental proceedings.
ITEM 4. SUBMISSION OF MATTERS TO A VOTE OF SECURITY HOLDERS
During the fourth quarter of 2003, no matters were submitted to a vote of our security holders.
ITEM 5. MARKET FOR REGISTRANT'S COMMON EQUITY AND RELATED STOCKHOLDER MATTERS
Market Information
As of the date of this report, there was no established public trading market for any class of our membership interests.
Holders
As of the date of this report, HIH was the only holder of record of our membership interests. HIH is owned 100%, directly and indirectly, by HMP. For more information, see "Item 1—Business—Ownership and History" above.
Distributions
Pursuant to our limited liability company agreement and the limited liability company agreement of HIH, we have a tax sharing arrangement with all of our and HIH's membership interest holders. Under the arrangement, because we are treated as a partnership for United States income tax purposes, we will make payments to our parent, HIH, which will in turn make payments to its membership interest holders, in an amount equal to the United States federal and state income taxes we and HIH would have paid had HIH been treated as a corporation for tax purposes. The arrangement also provides that, if we had previously made payments to HIH, and HIH had made payments out to its membership interest holders, we will receive cash payments back from the membership interest holders (through HIH) in amounts equal to the United States federal and state income tax refunds or benefit against future tax liabilities we would have received from the use of net operating losses or tax credits generated by us, up to the amount of payments that we had previously made. As of December 31, 2003, approximately $3.9 million is due to us from the membership interest holders (through HIH).
Except in accordance with the above paragraph, the HI Credit Facilities restrict our ability to pay dividends or other distributions on our equity interests, including prohibiting us from making distributions to HIH for the purpose of paying principal, interest or premium on the outstanding notes of HIH. The indentures governing our outstanding notes also place certain restrictions on our ability to pay dividends and make other distributions.
The restrictions contained in the indentures governing our notes, may prevent us from making any "restricted payments," including (i) any dividends, distributions or other payments to holders of our
29
equity interests or (ii) payments to purchase, redeem or otherwise acquire or retire for value any of our equity interests, subject to certain exceptions contained in such indentures.
ITEM 6. SELECTED FINANCIAL DATA
The following table sets forth selected financial data for our Company as of the dates and for the periods indicated. Information should be read in conjunction with our Consolidated Financial Statements and Notes thereto included on the pages immediately following the Index to Consolidated Financial Statements appearing on page F-1. See also "Item 7—Management's Discussion and Analysis of Financial Condition and Results of Operations."
| |
|
|
|
|
|
Predecessor Company |
|||||||||||||
|---|---|---|---|---|---|---|---|---|---|---|---|---|---|---|---|---|---|---|---|
| |
Year Ended December 31, 2003 |
Year Ended December 31, 2002 |
Year Ended December 31, 2001 |
Year Ended December 31, 2000 |
Six Months Ended December 31, 1999 |
Six Months Ended June 30, 1999 |
|||||||||||||
| |
(Millions of Dollars) |
||||||||||||||||||
| Consolidated Statements of Operations Data: | |||||||||||||||||||
| Revenues | $ | 5,245.5 | $ | 4,518.1 | $ | 4,575.2 | $ | 4,447.9 | $ | 1,997.3 | $ | 192.0 | |||||||
| Operating income | 175.9 | 228.1 | 171.2 | 421.8 | 197.3 | 52.6 | |||||||||||||
| Income (loss) from continuing operations | (130.9 | ) | 20.1 | (59.4 | ) | 150.7 | 80.6 | 21.5 | |||||||||||
Consolidated Balance Sheet Data: |
|||||||||||||||||||
| Working capital | $ | 418.5 | $ | 322.0 | $ | 309.5 | $ | 331.9 | $ | 456.7 | $ | 32.6 | |||||||
| Total assets | 5,492.7 | 5,167.3 | 4,862.1 | 4,815.4 | 4,818.4 | 577.9 | |||||||||||||
Long-term debt and other non- current liabilities |
3,384.6 |
3,190.9 |
3,027.1 |
2,806.9 |
2,934.2 |
474.6 |
|||||||||||||
Member's/stockholders' equity |
1,153.7 |
1,065.2 |
991.7 |
1,128.7 |
1,104.0 |
49.8 |
|||||||||||||
ITEM 7. MANAGEMENT'S DISCUSSION AND ANALYSIS OF FINANCIAL CONDITION AND RESULTS OF OPERATIONS
We derive our revenues, earnings and cash flow from the sale of a wide variety of differentiated and commodity chemicals. We manage our operations through our four principal operating segments: Polyurethanes, Performance Products, Pigments and Base Chemicals. We manufacture products at facilities located in North America, Europe, Asia, Australia and Africa, and our products are sold throughout the world. The major products of each reportable operating segment are as follows:
| Segment |
Products |
|
|---|---|---|
| Polyurethanes | MDI, TDI, TPU, polyols, aniline, PO and MTBE | |
| Performance Products | Surfactants, ethyleneamines and other performance chemicals | |
| Pigments | Titanium dioxide | |
| Base Chemicals | Ethylene, propylene, benzene, cyclohexane and paraxylene |
Our products are divided into two broad categories—differentiated and commodity chemicals. Our Polyurethanes and Performance Products businesses mainly produce differentiated products and our Pigments and Base Chemicals businesses mainly produce commodity chemicals. Among our commodity products, our Pigments business, while cyclical, tends to follow different trends and is not influenced by the same factors as our petrochemical-based commodity products. In addition, there are a limited
30
number of significant competitors in our Pigments business, relatively high barriers to entry and strong customer loyalty. Each of our four operating segments is impacted to varying degrees by economic conditions, prices of raw materials and global supply and demand pressures.
Historically, the demand for many of our Polyurethanes products, which accounted for 44% of our revenues in 2003, has been relatively resistant to changes in global economic conditions as industry growth in product demand has been strongly influenced by continuing product substitution, innovation and new product development. The stability of demand has also benefited from the wide variety of end markets for our Polyurethanes products. Historically, sales volumes of MDI, a Polyurethanes segment product, have grown at rates in excess of global GDP growth and margins for MDI have been relatively stable. However, in the past year, volatile feedstock pricing has negatively impacted overall margins. The global market for PO, also a Polyurethanes product, is influenced by supply and demand imbalances. PO demand is largely driven by growth in the polyurethane industry, and, as a result, growth rates for PO have generally exceeded GDP growth rates. As a co-product of our PO manufacturing process, we also produce MTBE. MTBE is an oxygenate that is blended with gasoline to reduce harmful vehicle emissions and to enhance the octane rating of gasoline. See "—Environmental Matters—MTBE Developments" below for more information on the legal and regulatory developments that may curtail or eliminate the use of MTBE in gasoline in the future.
In comparison to commodity businesses, the demand for many of the products we produce in our Performance Products segment historically has also been relatively resistant to changes in global economic conditions. Like our Polyurethanes segment, Performance Products growth in general is strongly influenced by product substitution, innovation and new product development. Also, demand stability benefits from a broad range of end markets. A significant portion of our Performance Products is sold into consumer end use applications including household detergents, personal care products and cosmetics. As such, historically, demand for these products has been relatively stable and tends to be less susceptible to changes in global economic conditions.
Historically, growth in demand for TiO2 pigments has generally been linked with GDP growth rates and has trended somewhat below overall GDP growth rates as strong growth in the developing world economies has been tempered by modest growth in the developed world economies. Our Pigments segment accounted for 19% of our 2003 revenues. Pigment prices have historically reflected industry-wide operating rates, but have typically lagged behind movements in these rates by up to twelve months due to the effects of product stocking and destocking by customers and suppliers, contract arrangements and cyclicality. The industry experiences some seasonality in its sales because sales of paints in Europe and North America, the largest end use for TiO2, are generally highest in the spring and summer months in those regions. This results in greater sales volumes in the first half of the year because the proportion of our TiO2 products sold in Europe and North America is greater than that sold in the southern hemisphere.
Many of the markets for the Base Chemicals products, particularly ethylene, propylene, paraxylene and cyclohexane, are cyclical and sensitive to changes in the balance between supply and demand, the price of raw materials, and the level of general economic activity. Historically, these markets have experienced alternating periods of tight supply and rising prices and profit margins, followed by periods of capacity additions resulting in over-capacity and falling prices and profit margins. Demand for the majority of our Base Chemicals has generally grown at rates that are approximately equal to or slightly greater than GDP growth. Market conditions during recent years have been characterized by a general weakening in demand and overcapacity. We believe that weak economic conditions have resulted in a contraction in production capacity. If this contraction in industry capacity is sustained and if demand growth returns to the rates which have been achieved historically, we believe that industry profitability will improve.
31
| |
Year Ended December 31, 2003 |
Year Ended December 31, 2002 |
Year Ended December 31, 2001 |
|||||||
|---|---|---|---|---|---|---|---|---|---|---|
| Revenues | $ | 5,245.5 | $ | 4,518.1 | $ | 4,575.2 | ||||
| Cost of goods sold | 4,661.1 | 3,902.7 | 3,990.1 | |||||||
| Gross profit | 584.4 | 615.4 | 585.1 | |||||||
| Expenses of selling, general, and administrative, research and development and other operating costs | 351.8 | 379.6 | 367.3 | |||||||
| Restructuring and plant closing costs | 56.7 | 7.7 | 46.6 | |||||||
| Operating income | 175.9 | 228.1 | 171.2 | |||||||
| Interest expense, net | (251.5 | ) | (245.4 | ) | (239.6 | ) | ||||
| Loss on accounts receivable securitization program | (32.4 | ) | (5.5 | ) | (12.8 | ) | ||||
| Other income (expense) | (1.3 | ) | 1.3 | (2.0 | ) | |||||
| Loss before income taxes, minority interests and cumulative effect of accounting change | (109.3 | ) | (21.5 | ) | (83.2 | ) | ||||
| Income tax benefit (expense) | (21.6 | ) | 41.5 | 26.0 | ||||||
| Minority interests | — | 0.1 | (2.2 | ) | ||||||
| Cumulative effect of accounting change | — | — | (1.5 | ) | ||||||
| Net income (loss) | $ | (130.9 | ) | $ | 20.1 | $ | (60.9 | ) | ||
| Interest expense, net | 251.5 | 245.4 | 239.6 | |||||||
| Income tax expense (benefit) | 21.6 | (41.5 | ) | (26.0 | ) | |||||
| Cumulative effect of accounting change | — | — | 1.5 | |||||||
| Depreciation and amortization | 277.9 | 256.2 | 229.0 | |||||||
| EBITDA(1) | $ | 420.1 | $ | 480.2 | $ | 383.2 | ||||
32
Included in EBITDA are the following items of income (expense):
| |
Year Ended December 31, 2003 |
Year Ended December 31, 2002 |
Year Ended December 31, 2001 |
|||||||||
|---|---|---|---|---|---|---|---|---|---|---|---|---|
| Foreign exchange gains — unallocated | $ | 95.3 | $ | 47.0 | $ | 2.9 | ||||||
| Loss on accounts receivable securitization program | (32.4 | ) | (5.5 | ) | (12.8 | ) | ||||||
| Restructuring and plant closing costs: | ||||||||||||
| Polyurethanes | $ | (28.1 | ) | $ | — | $ | (44.7 | ) | ||||
| Performance Products | (22.1 | ) | (4.6 | ) | — | |||||||
| Pigments | (6.5 | ) | (3.1 | ) | (1.9 | ) | ||||||
| Total restructuring and plant closing costs | $ | (56.7 | ) | $ | (7.7 | ) | $ | (46.6 | ) | |||
Year Ended December 31, 2003 Compared to Year Ended December 31, 2002
For the year ended December 31, 2003, we had a net loss of $130.9 million on revenues of $5,245.5 million, compared to net income of $20.1 million on revenues of $4,518.1 million for 2002. The increase of $151.0 million in net loss was the result of the following items:
33
segment's operations worldwide. All these charges are part of an overall corporate cost reduction program that is expected to be implemented from 2003 to 2005.
The following table sets forth the revenues and EBITDA for each of our operating segments.
| |
Year Ended December 31, 2003 |
Year Ended December 31, 2002 |
||||||
|---|---|---|---|---|---|---|---|---|
| Revenues | ||||||||
| Polyurethanes | $ | 2,297.5 | $ | 2,066.0 | ||||
| Performance Products | 659.6 | 574.3 | ||||||
| Pigments | 1,009.9 | 880.3 | ||||||
| Base Chemicals | 1,421.8 | 1,097.5 | ||||||
| Eliminations | (143.3 | ) | (100.0 | ) | ||||
| Total | $ | 5,245.5 | $ | 4,518.1 | ||||
| Segment EBITDA | ||||||||
| Polyurethanes | $ | 233.4 | $ | 365.1 | ||||
| Performance Products | (15.8 | ) | 27.2 | |||||
| Pigments | 105.4 | 68.3 | ||||||
| Base Chemicals | 77.7 | 13.8 | ||||||
| Corporate and other | 19.4 | 5.8 | ||||||
| Total | $ | 420.1 | $ | 480.2 | ||||
Polyurethanes
For the year ended December 31, 2003, Polyurethanes revenues increased by $231.5 million, or 11%, to $2,297.5 million from $2,066.0 million for 2002. MDI sales revenue increased by 11%, due to 11% higher average selling prices and relatively flat volumes. The overall lack of MDI volume growth
34
was largely the result of a reduction in spot sales to co-producers in 2003. MDI sales volumes, excluding spot sales, rose by 6%, with increases of 20%, 6% and 2% in Asia, the Americas and Europe, respectively, driven by the improved rigid polyurethanes market in the fourth quarter 2003. MDI overall average selling prices increased by 11%, 7% of which was attributable to the strength of the major European currencies versus the U.S. dollar and 4% of which was attributable to our continued efforts to increase sales prices as raw material costs increased. Polyol sales revenue increased by 16% as sales volumes increased by 4%, consistent with underlying MDI volumes, and average selling prices increased by 12%, 7% of which was attributable to the strength of the major European currencies versus the U.S. dollar. PO revenue decreased 8%, primarily due to the conversion of certain sales to a tolling arrangement, which affected revenues but only had a minimal impact on gross margin. MTBE sales revenue increased by 14% due to a 7% increase in volumes and a 7% increase in selling prices due to stronger crude oil and gasoline markets.
For the year ended 2003, Polyurethanes segment EBITDA decreased by $131.7 million to $233.4 million from $365.1 million for the same period in 2002. Lower EBITDA resulted mainly from a $271.9 million increase in raw material and energy costs, partly offset by a $200.5 million improvement in average selling prices. We also recorded $28.1 million in restructuring charges in connection with the integration of our global flexible products unit into our urethane specialties unit and cost reduction efforts at our Rozenburg, Netherlands site. These charges are part of an overall cost reduction program that is expected to be implemented and recorded from 2003 to 2005. We also incurred a $2.5 million charge due to the write-off of an asset formerly used in connection with our Geismar, Louisiana TDI facility. Fixed production costs increased $33.6 million, primarily due to the $18.9 million impact of the strengthening of the major European currencies versus the U.S. dollar, increased pension costs of $10.1 million and a $7.1 million fixed cost absorption as a result of a reduction in inventory levels. SG&A costs also increased $1.5 million due to a $16.6 million adverse foreign currency exchange impact, partly offset by $15.3 million in cost savings as measured in local currencies.
Performance Products
For the year ended 2003, Performance Products revenues increased by $85.3 million, or 15%, to $659.6 million from $574.3 million in 2002. Overall, Performance Products sales volumes fell by 4% and average selling prices increased by 20%, of which 12% was due to foreign currency movements. Surfactants revenues increased by 6% as compared to 2002, resulting from a 15% increase in average selling prices and a 7% decrease in sales volumes. Average selling prices of surfactants in local currencies fell due to intense competition, but our selling prices increased by 19% due to the strength of the major European currencies versus the U.S. dollar. The reduction in surfactants' sales volumes was largely the result of softer European demand, competitive activity and decreased export business as a result of the strength of the major European currencies versus the U.S. dollar. Ethyleneamines revenues increased by 17% compared with 2002, resulting primarily from a 7% increase in average selling prices and a 9% increase in sales volumes. The increase in ethyleneamines average selling prices was due to price increases implemented to offset increased raw material costs. Sales volumes of ethyleneamines increased largely due to higher export sales. Other sales revenues, primarily amines, increased by 56% compared with 2002. This increase resulted primarily from a 19% increase in sales volumes and a 31% increase in average selling prices. These increases were primarily the result of the initiation of tolling agreements with affiliates.
For the year ended 2003, Performance Products segment EBITDA decreased by $43.0 million to a loss of $15.8 million from a profit of $27.2 million in 2002. Restructuring costs in the year ended December 31, 2003 were $17.5 million higher than in the same period in 2002, due to the $20.1 million charge taken in connection with the closure of certain units at our Whitehaven, UK facility in September 2003 and $2.0 million charged in respect of severance costs arising from the closure of an administrative office in London, UK, the rationalization of our surfactants technical center in Oldbury,
35
UK and the restructuring of our Spanish facility in Barcelona, Spain. Lower sales volumes negatively impacted EBITDA by approximately $3.7 million. An $89.0 million increase in selling prices was largely offset by raw material cost increases of $87.5 million. Fixed production costs were relatively unchanged as negative currency impacts of $10.0 million were offset by the effect of cost reduction programs and the operation of only one of our two ethyleneamines units at our Freeport, Texas facility for much of the year. SG&A and other operating costs increased by $22.6 million, of which $9.0 million was attributable to adverse currency movements and $9.0 million of which was due mainly to costs paid to Huntsman LLC under tolling and commercial arrangements for the sale of performance products on their behalf, which were entirely offset by the margin earned on the sale of such products.
Pigments
For the year ended December 31, 2003, Pigments revenues increased by $129.6 million, or 15%, to $1,009.9 million from $880.3 million for the same period in 2002. Average selling prices increased by 13%, of which 9% resulted from the strength of the major European currencies versus the U.S. dollar, and the remainder of which resulted from improved supply and demand conditions. Average selling prices as measured in local currencies increased by 5%, 3% and 6% in Europe, North America and Asia-Pacific ("APAC"), respectively, due to price increases implemented in early 2003 as a result of favorable supply and demand conditions that existed at that time. Sales volumes increased overall by 1%, with North America and APAC both showing an increase of 6%, while Europe was unchanged.
For the year ended December 31, 2003, Pigments segment EBITDA increased by $37.1 million to $105.4 million from $68.3 million in 2002. The increase in EBITDA is primarily a result of a $114.6 million increase in selling prices and the $5.3 million impact of the 1% increase in sales volume, partially offset by an increase in manufacturing costs of $83.6 million. The manufacturing costs increase was caused mainly by foreign currency movements of $84.3 million, which were partially offset by savings of $4.8 million, as measured in local currencies, from our cost reduction initiatives. SG&A and other operating costs increased by $1.6 million mainly due to an increase in restructuring charges of $3.4 million and a $3.2 million increase in pension costs, partially offset by the release of $2.6 million of surplus environmental provisions recorded in relation to our Tracy, Canada facility which was closed in 2000.
Base Chemicals
For the year ended December 31, 2003, Base Chemicals revenues increased by $324.3 million, or 30%, to $1,421.8 million from $1,097.5 million for 2002. The increase in revenues was caused by a 33% increase in average selling prices, partially offset by a 3% reduction in overall sales volumes. Base Chemicals average selling prices were up 21% in response to higher raw material and energy prices and favorable supply and demand conditions, and 12% due to the strength of the major European currencies versus the U.S. dollar. The reduction in Base Chemicals volumes was caused primarily by reduced sales of raw materials, primarily naptha, which we sell from time to time as favorable opportunities arise. Ethylene revenues increased 39%, resulting from a 12% increase in volumes and a 24% increase in average sales prices. Propylene revenues increased 50%, resulting from a 17% increase in volumes and a 28% increase in average sales prices. Paraxylene revenues increased 28%, resulting from a 4% decrease in volumes and a 34% increase in average sales prices. Benzene revenues increased 17%, resulting from a 15% decrease in volumes and a 37% increase in average sales prices. Cyclohexane revenues increased 41%, resulting from a 7% increase in volumes and a 32% increase in average sales prices. Sales volume increases for ethylene and propylene reflected increased demand and the fact that 2002 included a turnaround at our Wilton, U.K. olefins facility.
36
For the year ended December 31, 2003 Base Chemicals segment EBITDA increased by $63.9 million to $77.7 million from $13.8 million in 2002. Increased segment EBITDA primarily resulted from the impact of increased selling prices of $348.4 million, offset by increased raw material costs of $258.2 million, mainly due to a 23% increase in the cost of our main feedstock, naphtha. Fixed production costs increased $37.0 million, of which $16.0 million was due to foreign currency impacts, $11.0 million due to costs reclassified from SG&A and $7.0 million due to higher pension costs. SG&A costs decreased $11.9 million, which included $11.0 million of costs reclassified as fixed production costs, insurance claim recoveries of $2.6 million and recoveries from the sale of precious metals used in the manufacturing process amounting to $3.0 million. These SG&A cost decreases were partially offset by $2.4 million associated with various terminated capital projects and reduced foreign currency translation gains of $1.9 million.
Corporate and Other
Corporate and other items includes unallocated corporate overhead, loss on our accounts receivable securitization program and unallocated foreign exchange gains and losses. For the year ended December 31, 2003, EBITDA from corporate and other items increased by $13.6 million to $19.4 million from $5.8 million for 2002. The increase resulted primarily from increased unallocated foreign exchange gains caused primarily by the strength of the major European currencies versus the U.S. dollar. Unallocated foreign exchange gains were $48.3 million higher, with a gain of $95.3 million in the year ended December 31, 2003 as compared to a gain of $47.0 million in the year ended December 31, 2002. In general, our unallocated foreign exchange gains and losses result primarily from movements in the foreign exchange rates used to translate the current portion of intercompany balances to the functional currency at the end of the period and from the translation of foreign currency receivable balances sold into our accounts receivable securitization program to U.S. dollars.
The increased unallocated foreign exchange gains were partially offset by increased losses on the accounts receivable securitization program, which increased by $26.9 million to a loss of $32.4 million in the year ended December 31, 2003 as compared to a loss of $5.5 million in 2002. Losses on the accounts receivable securitization program include the discount on receivables sold into the program, fees and expenses associated with the program and gains (losses) on foreign currency hedge contracts mandated by the terms of the program to hedge currency exposures on the collateral supporting the off-balance sheet debt issued. The increased losses on the accounts receivable securitization program were primarily due to losses on foreign exchange hedge contracts mandated by our accounts receivable securitization program and the increase in the size of our securitization facility effective October 2002. Other cost increases were the result of a higher management fee paid to Huntsman LLC of $3.5 million, an asset valuation adjustment of $2.8 million, and the expensing of $1.1 million of abandoned transaction costs.
Year Ended December 31, 2002 Compared to Year Ended December 31, 2001
For the year ended December 31, 2002, we had net income of $20.1 million on revenues of $4,518.1 million, compared to a net loss of $60.9 million on revenues of $4,575.2 million in 2001. The increase of $81.0 million in net income was the result of the following items:
37
38
The following table sets forth the sales and income for each of our operating segments. Segment income is operating income excluding unallocated items.
| |
Year Ended December 31, 2002 |
Year Ended December 31, 2001 |
||||||
|---|---|---|---|---|---|---|---|---|
| Revenues | ||||||||
| Polyurethanes | $ | 2,066.0 | $ | 2,073.7 | ||||
| Performance Products | 574.3 | 455.3 | ||||||
| Pigments | 880.3 | 872.1 | ||||||
| Base Chemicals | 1,097.5 | 1,268.6 | ||||||
| Eliminations | (100.0 | ) | (94.5 | ) | ||||
| Total | $ | 4,518.1 | $ | 4,575.2 | ||||
| Segment EBITDA | ||||||||
| Polyurethanes | $ | 365.1 | $ | 262.7 | ||||
| Performance Products | 27.2 | 21.1 | ||||||
| Pigments | 68.3 | 139.4 | ||||||
| Base Chemicals | 13.8 | 20.4 | ||||||
| Corporate and other | 5.8 | (60.4 | ) | |||||
| Total | $ | 480.2 | $ | 383.2 | ||||
Polyurethanes
For the year ended December 31, 2002, Polyurethanes revenues decreased by $7.7 million to $2,066.0 million from $2,073.7 million in 2001. MDI sales volumes increased by 4%. Volumes in the Americas increased by 11% and volumes in Asia decreased by 5%, while volumes in Europe remained stable. Volumes in the Americas increased due to a strong growth in the Americas MDI market. MDI volumes in Asia were lower primarily due to reduced sales under co-producer arrangements and a slowdown in the insulation foam market. MDI average selling prices decreased by 1%, with prices down in all regions except Europe, where prices increased by 3% primarily due to the strengthening of the major European currencies versus the U.S. dollar. Polyols sales revenue increased by 8%, due to a 9% increase in volumes. PO sales revenue decreased by 1% with volumes down 6% due to the conversion of some product sales agreements to tolling arrangements while average selling prices increased by 4% in 2002. MTBE sales revenue decreased by 7% as compared to the same period in 2001. MTBE sales volumes were relatively unchanged from the prior year, however, average selling prices decreased by 6% due to lower gasoline prices in 2002.
For the year ended 2002, Polyurethanes segment EBITDA increased by $102.4 million to $365.1 million from $262.7 million for the same period in 2001. Increased EBITDA resulted from increased overall sales volumes and overall lower energy and feedstock prices, which more than offset the decline in average selling prices discussed above. Segment EBITDA also increased as 2001 results included a charge of $44.7 million which was mainly the result of restructuring activities and the closure of our Shepton Mallet, UK polyols manufacturing facility. SG&A costs, including research and development costs, remained relatively flat in 2002 as compared to 2001. Lower costs resulting from our cost reduction initiatives were offset by foreign exchange losses, bad debt expenses and increased pension costs in 2002.
Performance Products
For the year ended December 31, 2002, Performance Products revenues increased by $119.0 million, or 26%, to $574.3 million from $455.3 million in 2001. Surfactants revenues increased by
39
45% due to a 43% increase in sales volumes while average selling prices remained relatively unchanged. Increased surfactants revenues are largely due to non-comparable sales as the surfactants business was acquired in April 2001. Excluding non-comparable sales, surfactants revenues increased by 10% in 2002 as compared to 2001. Ethyleneamines revenues increased by 27% due to a 45% increase in sales volumes and a 29% decrease in average selling prices. Increased ethlyeneamines revenues were due to non-comparable sales from the ethyleneamines business we acquired in February 2001. Excluding non-comparable sales, ethyleneamines sales increased by 14%. Increased volumes and decreased selling prices mainly resulted from increased sales into the APAC region which has lower average selling prices. Increased volumes were due to improved market conditions in 2002 and the benefit of starting a second production train at our Freeport, Texas facility in late third quarter 2002.
For the year ended 2002, Performance Products segment EBITDA increased by $6.1 million to $27.2 million from $21.1 million in 2001. During 2002 Performance Products benefited from increased overall sales volumes, lower average raw materials costs and non-comparable results for businesses acquired in the first quarter 2001. These results were offset by increased SG&A costs resulting from ongoing restructuring activities, including $4.6 million of costs related to the closure of our Alcover, Spain surfactants plant.
Pigments
For the year ended December 31, 2002, Pigments revenues increased by $8.2 million, or 1%, to $880.3 million from $872.1 million in 2001. Sales volumes increased by 7% due to higher end-use demand for TiO2 and customer re-stocking activity ahead of expected price increases. Sales volumes increased by 14%, 14% and 2% in North America, Asia, and Europe, respectively. Average selling prices decreased by 6%, with average selling prices decreasing by 10%, 9%, and 3% in North America, Asia, and Europe, respectively, due to an unfavorable industry supply-demand balance during 2001, which negatively impacted selling prices in 2002. Lower local currency prices were partially offset by favorable movements in exchange rates. Average selling prices were increasing toward the end of the year with average selling prices 7% higher in the fourth quarter of 2002 than they were in the fourth quarter of 2001.
For the year ended December 31, 2002, Pigments segment EBITDA decreased by $71.1 million to $68.3 million from $139.4 million in the same period in 2001. The decline in segment earnings is mainly due to an unfavorable supply-demand balance during 2001, which negatively impacted selling prices in 2002. Manufacturing costs increased mainly due to higher pension and insurance costs and adverse movements in currency exchange rates. SG&A costs increased in 2002 mainly due to costs associated with the implementation of an SAP software system and increased pension costs. During 2002, we incurred a $3.1 million charge from asset write-offs related to the closure of a facility in Greatham, UK.
Base Chemicals
For the year ended December 31, 2002, Base Chemicals revenues decreased by $171.1 million, or 13%, to $1,097.5 million from $1,268.6 million in 2001. Lower revenues were largely due to decreased average selling prices on ethylene and paraxylene, decreased sales volumes in ethylene and propylene and lower levels of activity in the hedging of feedstocks settling through revenues. The discontinuance of cumene sales, which occurred in the first quarter of 2002, also contributed to the decreased revenue. Average selling prices of ethylene and paraxylene fell by 11% in 2002 as compared with 2001, due to the impact of lower underlying feedstock costs. Benzene average selling prices increased by 16% in 2002 as the result of improved market conditions. Propylene prices were relatively unchanged. Sales volumes of ethylene, propylene and benzene decreased by 6%, 22% and 16%, respectively, while paraxylene and cyclohexane sales volumes increased by 17% and 61%, respectively. Ethylene and propylene sales were lower due to the turnaround and inspection overhaul in the second quarter, and
40
reduced demand in the fourth quarter. Cyclohexane sales were higher in 2002 due to higher production.
For the year ended December 31, 2002, Base Chemicals segment EBITDA decreased by $6.6 million to $13.8 million from $20.4 million in 2001. Decreased EBITDA was mainly due to lower sales volumes of ethylene and propylene, and lower selling prices for ethylene and paraxylene. Margins in the olefins market were lower in 2002. The effect of reduced selling prices was compounded by a 1% increase in the cost of naphtha, our primary feedstock. Lower segment EBITDA also resulted from the cost of purchasing product to cover the second quarter turnaround and inspection overhaul of our olefins facility. SG&A costs, including research and development expenditures, were relatively unchanged in 2002 as compared to 2001.
Corporate and Other
Corporate and other items includes unallocated corporate overhead, loss on our accounts receivable securitization program and unallocated foreign exchange gains and losses. For the year ended December 31, 2002, EBITDA from corporate and other items increased by $66.2 million to $5.8 million from a loss of $60.4 million for 2001. Administrative and other expenses decreased mainly due to $47.0 million of unallocated foreign exchange gains in 2002 versus $2.9 million of gains in 2001. Unallocated foreign exchange gains resulted from the strengthening of the major European currencies versus the U.S. dollar. In addition, loss on the accounts receivable securitization program decreased $7.3 million to a loss of $5.5 million in 2002 from a loss of $12.8 million in 2001. Unallocated SG&A expenses decreased by approximately $11.0 million due to lower legal costs in 2002 and certain abandoned transaction costs in 2001.
Liquidity and Capital Resources
Cash
Net cash provided by operating activities for the year ended December 31, 2003 decreased to $48.5 million from $157.5 million for 2002. The variance is primarily attributable to reduced operating income as explained above in addition to a net increase in cash used in net working capital in 2003.
Net cash used in investing activities for the year ended December 31, 2003 decreased to $135.7 million from $188.9 million for 2002. The decrease in cash used in 2003 was largely attributable to increased spending in 2002 in connection with the ICON modernization and expansion of our titanium dioxide manufacturing facility at Greatham, U.K. and the SAP project within our Pigments segment, both of which were completed in 2002.
Net cash provided by financing activities for the year ended December 31, 2003 increased to $54.4 million, as compared to $1.1 million for 2002. The increase in cash provided by financing activities is mainly a result of increased net borrowings to fund operating cash requirements as explained above.
Debt and Liquidity
On April 11, 2003, we sold $150 million (in addition to $300 million previously issued) in aggregate principal amount of 9.875% Senior Notes due 2009 (the "HI Senior Notes"). The offering was priced at 105.25% plus accrued interest from March 1, 2003. We used approximately $26 million of the net proceeds to repay part of the revolving portion of the HI Credit Facilities. The balance of the net proceeds was used primarily to prepay the scheduled amortization due under the term portion of the HI Credit Facilities. We also have outstanding $600 million and €450 million 10.125% Senior Subordinated Notes (the "Subordinated Notes").
41
The HI Credit Facilities consist of a revolving loan facility of up to $400 million that matures on June 30, 2005 (the "HI Revolving Facility"), a term B loan facility of $620.1 million as of December 31, 2003 that matures on June 30, 2007, and a term C loan facility of $620.1 million as of December 31, 2003 that matures on June 30, 2008. As of December 31, 2003, we had outstanding variable rate borrowings of approximately $1.3 billion and the weighted average interest rate of these borrowings was approximately 5.6%. This weighted average rate does not consider the effects of interest rate hedging activities.
On October 17, 2003, we amended the HI Credit Facilities. The amendment provides, among other things, for changes to certain financial covenants, including an increase in the leverage and interest coverage ratios, a decrease in the annual amount of permitted capital expenditures, and a decrease in the consolidated net worth covenant. With the exception of the changes relating to capital expenditures, these changes to the financial covenants apply to the quarterly period ended September 30, 2003 and will continue through the quarterly period ending December 31, 2004. The amendment also allowed for the issuance of $205 million of additional term B and term C loans, which we accomplished on October 22, 2003, the net proceeds of which have been applied to pay down the HI Revolving Facility by approximately $53 million, and the remainder of the net proceeds have been applied to repay, in full, the term A loan. As a result of these refinancings, we have no scheduled maturities in 2004 and scheduled maturities of approximately $12 million in each of 2005 and 2006 under our term B and term C loans. The amendment also allows us to issue additional senior unsecured notes up to a maximum of $800 million.
We depend upon the $400 million HI Revolving Facility to provide liquidity for our operations and working capital needs. As of December 31, 2003, we had $22.0 million of outstanding borrowings and approximately $7 million of outstanding letters of credit under the HI Revolving Facility, and we had $97.8 million in cash balances on the balance sheet. We also maintain $25.0 million of short-term overdraft facilities, of which $17.5 million was available at December 31, 2003. Total cash and unused borrowing capacity as of December 31, 2003 was approximately $486 million. The HI Revolving Facility matures in June 2005, and we anticipate addressing the maturity of this facility within the next 6 to 12 months.
We also depend upon an accounts receivable securitization program arranged by JP Morgan, under which interests in certain of our trade receivables are transferred to a qualified off-balance sheet entity (the "Receivables Trust"). The Receivables Trust is not an affiliate of our Company. The acquisitions of these receivables by the Receivables Trust are financed through the issuance of commercial paper and/or medium term notes. The debt associated with the commercial paper and medium term notes is not reflected on our balance sheet. The accounts receivable securitization program is an important source of liquidity to our Company.
A portion of the medium term notes (€90.5 million) is denominated in euros and is subject to fluctuation in currency rates against the U.S. dollar. The total outstanding balance of medium term notes is approximately $198 million in U.S. dollar equivalents as of December 31, 2003. In addition to medium term notes, the Receivables Trust also maintains an annual commitment with a third party to issue commercial paper for an amount up to $125 million. As of December 31, 2003, the total outstanding balance of such commercial paper was approximately $100 million. We are currently in the process of amending this commercial paper facility to be a multiyear, multicurrency facility (U.S. dollars and euros) that would mature in March 2007.
Subject to the annual seasonality of our accounts receivable, we estimate that the total liquidity resources from the accounts receivable securitization program may range between $270 million to $310 million at certain periods during a calendar year. As of December 31, 2003, the Receivables Trust had approximately $432 million of total assets (consisting of cash and accounts receivable), and $198 million of medium term notes and $100 million of commercial paper outstanding. The weighted
42
average interest rates on the medium term notes and commercial paper was approximately 2.1% as of December 31, 2003. However, losses on the accounts receivable securitization program in 2003 were $32.4 million. Losses on the accounts receivable securitization program include the discount on receivables sold into the program, fees and expenses associated with the program and gains (losses) on foreign currency hedge contracts mandated by the terms of the program to hedge currency exposures on the collateral supporting the off-balance sheet debt issued. For the year ended December 31, 2003, losses on the accounts receivable securitization program include losses of $24.6 million on foreign currency hedge contracts mandated by the accounts receivable securitization program. We believe that a multicurrency facility will enable us, in the future, to better naturally hedge the off-balance sheet debt to the underlying collateral supporting such debt and thereby reduce the impact on, and need for, foreign currency hedges under the accounts receivable securitization program.
The HI Credit Facilities require a mandatory prepayment to the extent that the proceeds from the securitization program exceed $310 million. To date, proceeds from the accounts receivable securitization program have not exceeded this limit. While we do not anticipate it, if at any time we were unable to sell sufficient receivables into the program to support the volume of commercial paper and medium term notes issued under the program, we would be required to inject cash into the program as collateral. Under such circumstance, and depending on the timing of such circumstance, the requirement to provide cash collateral to the program could have a negative effect on our liquidity.
We believe our current liquidity, together with funds generated by our operations, is sufficient to meet the short-term and long-term needs of our businesses, including funding operations, making capital expenditures and servicing our debt obligations in the ordinary course. We believe we are currently in compliance with the covenants contained in the agreements governing our debt obligations.
Contractual Obligations and Commercial Commitments
Our obligations under long-term debt, lease agreements, and other contractual commitments as of December 31, 2003 are summarized below (in millions):
| |
2004 |
2005-2007 |
2008-2009 |
After 2009 |
Total |
||||||||||
|---|---|---|---|---|---|---|---|---|---|---|---|---|---|---|---|
| Long-term debt | $ | 0.1 | $ | 669.1 | $ | 2,229.3 | $ | 16.4 | $ | 2,914.9 | |||||
| Capital lease obligations | 1.7 | 5.2 | 3.4 | 1.9 | 12.2 | ||||||||||
| Operating leases | 15.2 | 28.0 | 7.9 | 40.2 | 91.3 | ||||||||||
| Purchase commitments(1) | 627.3 | 966.7 | 152.4 | 228.9 | 1,975.3 | ||||||||||
| Total | $ | 644.3 | $ | 1,669.0 | $ | 2,393.0 | $ | 287.4 | $ | 4,993.7 | |||||
43
Restructuring and Plant Closing Charges
We have incurred restructuring and plant closing costs totaling $56.7 million, $7.7 million and $46.6 million for the years ended December 31, 2003, 2002 and 2001, respectively.
2003 Restructuring
In March 2003, our Polyurethanes segment announced that it would integrate its global flexible products unit into its urethane specialties unit, and we recorded a restructuring charge of $19.2 million for workforce reductions of approximately 118 employees. In June 2003, our Polyurethanes segment announced further restructuring at its Rozenburg, Netherlands site, related primarily to workforce reductions of approximately 54 employees. The total estimated costs for the Rozenburg restructuring is estimated to be $12.0 million and will be recorded as expense during 2003 to 2005. During 2003, $7.1 million was recorded as expense for this restructuring. In December 2003, our Polyurethanes segment announced additional restructuring at Polyurethanes sites across the world, related primarily to workforce reductions of approximately 53 employees. The total estimated cost for this restructuring is estimated to be $6.7 million and will be recorded as expense during 2003 and 2004. During 2003, $1.8 million was recorded as expense for this restructuring. At December 31, 2003, $13.4 million remains in the reserve for restructuring and plant closing costs related to these restructuring activities.
In June 2003, we announced that our Performance Products segment would close a number of plants at our Whitehaven, UK facility and reduce its workforce by approximately 85 employees. In 2003, a charge of $20.1 million was recorded representing $11.4 million relating to an impairment of assets at Whitehaven (in connection with the plant shutdowns) and $8.7 million of workforce reduction costs. We also recorded a $2.0 million charge in respect of severance costs arising from the closure of an administrative office in London, UK, the rationalization of our surfactants technical center in Oldbury, UK and the restructuring of our Spanish facility in Barcelona, Spain. At December 31, 2003, $2.4 million remains in the reserve for restructuring and plant closing costs related to these restructuring activities. In March 2004, we announced an additional restructuring at our Whitehaven, UK facility related to the relocation and consolidation of various plants, equipment and workshop facilities, and the development of a centralized control room to help improve the integrity and productivity of the main site assets. Total restructuring costs associated with this project are expected to be $11.1 million and include an asset write down of approximately $5.0 million and a reduction in workforce of approximately 45 employees. The remaining restructuring costs will be recorded as expense during 2004 to 2007.
In August 2003, we announced restructuring activities related to our global workforce reductions of approximately 250 employees in our Pigments segment. The overall cost reduction program for this segment is estimated to be approximately $23.0 million and will be implemented and recorded from 2003 to 2005. During 2003, we recorded a restructuring charge of $6.5 million related to workforce reductions of approximately 63 employees across all of our Pigments operations worldwide. At December 31, 2003, $4.3 million remains in the reserve for restructuring and plant closing costs related to these restructuring activities.
2002 Restructuring
In 2002, our Pigments segment recorded $3.1 million in asset write-downs related to the closure of our titanium dioxide manufacturing facility in Greatham, UK.
During 2002, our Performance Products segment recorded $4.6 million in charges which relate to restructuring and the write-down of fixed assets. The costs relate to the closure of the Alcover, Spain surfactants plant for $1.4 million, write-down of $1.6 million related to the assets of the Castiglione, Italy surfactants plant and various sales offices closed and $1.6 million for other exit costs.
44
At December 31, 2003, $2.4 million remains in the reserve for restructuring and plant closing costs related to the 2002 restructuring.
2001 Restructuring
During 2001, our Polyurethanes segment announced a cost reduction program which included the closure of the Shepton Mallet, U.K. polyols manufacturing facility by the end of 2002, resulting in a charge of $44.7 million. The program included reductions in workforce of approximately 270 employees at the Shepton Mallet facility and other locations. Approximately $7.8 million was recorded to write-down the fixed assets, $36.1 for employee termination benefits and $0.8 million for other exit costs.
Our Pigments segment recorded $1.9 million in restructuring charges related to a workforce reduction of approximately 50 employees.
As of December 31, 2003, all costs related to the 2001 restructuring programs were paid.
As of December 31, 2003, accrued restructuring and plant closing costs consist of the following (dollars in millions):
| |
2001 Charge |
2002 Charge |
2003 Charge |
Non-cash Charge |
Cash Payments |
December 31, 2003 |
||||||||||||
|---|---|---|---|---|---|---|---|---|---|---|---|---|---|---|---|---|---|---|
| Property, plant and equipment | $ | 7.8 | $ | 6.1 | $ | 11.4 | $ | (25.3 | ) | $ | — | $ | — | |||||
| Workforce reductions | 38.0 | — | 45.3 | (60.8 | ) | 22.5 | ||||||||||||
| Other exit costs | 0.8 | 1.6 | (2.4 | ) | — | |||||||||||||
| Total | $ | 46.6 | $ | 7.7 | $ | 56.7 | $ | (25.3 | ) | $ | (63.2 | ) | $ | 22.5 | ||||
Off-Balance Sheet Arrangements
As discussed in "—Debt and Liquidity" above, we maintain an accounts receivable securitization program arranged by JP Morgan, under which interests in certain of our trade receivables are transferred to the Receivables Trust, a qualified special-purpose off-balance-sheet entity. The Receivables Trust is not an affiliate of our Company. The acquisitions of these receivables by the Receivables Trust are financed through the issuance of commercial paper and/or medium term notes. The debt associated with the commercial paper and medium term notes is not reflected on our balance sheet. The accounts receivable securitization program is an important source of liquidity to our Company.
A portion of the medium term notes (€90.5 million) is denominated in euros and is subject to fluctuation in currency rates against the U.S. dollar. The total outstanding balance of medium term notes is approximately $198 million in U.S. dollar equivalents as of December 31, 2003. In addition to medium term notes, the Receivables Trust also maintains an annual commitment with a third party to issue commercial paper for an amount up to $125 million. As of December 31, 2003, the total outstanding balance of such commercial paper was approximately $100 million. We are currently in the process of amending this commercial paper facility to be a multiyear, multicurrency facility (U.S. dollars and euros) that would mature in March 2007.
Subject to the annual seasonality of our accounts receivable, we estimate that the total liquidity resources from the accounts receivable securitization program may range between $270 million to $310 million at certain periods during a calendar year. As of December 31, 2003, the Receivables Trust had approximately $432 million of total assets (consisting of cash and accounts receivable), and $198 million of medium term notes and $100 million of commercial paper outstanding. The weighted average interest rates on the medium term notes and commercial paper was approximately 2.1% as of December 31, 2003. However, losses on the accounts receivable securitization program in 2003 were
45
$32.4 million. Losses on the accounts receivable securitization program include the discount on receivables sold into the program, fees and expenses associated with the program and gains (losses) on foreign currency hedge contracts mandated by the terms of the program to hedge currency exposures on the collateral supporting the off-balance sheet debt issued. For the year ended December 31, 2003, losses on the accounts receivable securitization program include losses of $24.6 million on foreign currency hedge contracts mandated by the accounts receivable securitization program. We believe that a multicurrency facility will enable us, in the future, to better naturally hedge the off-balance sheet debt to the underlying collateral supporting such debt and thereby reduce the impact on, and need for, foreign currency hedges under the accounts receivable securitization program.
During the year ended December 31, 2003, we sold approximately $4,132 million in receivables and collected $4,136 million.
Investing Activities
Capital expenditures for the year ended December 31, 2003 were $127.4 million, a decrease of approximately $63.1 million as compared to $190.5 million for 2002. The decrease was largely attributable to expenditures in connection with the ICON 2 modernization and expansion of our titanium dioxide manufacturing facility at Greatham, U.K. and the SAP project in our Pigments segment, both of which were completed in 2002. We expect to spend approximately $180 million on capital expenditures during 2004, which would include any expenditures for the proposed LDPE facility at Wilton, U.K. in the event board and other approvals are sought and obtained in connection with this project. In addition, we expect to spend approximately $25 million (approximately $13 million of which will be recorded as capital expenditures and $12 million of which will be recorded as investments), during 2004 as an investment in our Chinese MDI joint ventures. During 2003, we made our initial contributions of approximately $12 million in our Chinese MDI joint ventures (approximately $6 million of which has been recorded as a capital expenditure and $6 million of which has been recorded as an investment) and we expect to contribute up to a total of approximately $85 million to the Chinese MDI joint ventures over the next several years (approximately $35 million to be recorded as capital expenditures and approximately $50 million to be recorded as investments).
In connection with our agreements with our Rubicon and Louisiana Pigment joint ventures, we are obligated to fund our proportionate share of expenditures. During the years ended December 31, 2003 and 2002, we made net investments of $3.0 million and $3.3 million, respectively, in Rubicon. During the years ended December 31, 2003 and 2002, we received net distributions of $0.8 million and $8.0 million, respectively, from Louisiana Pigment.
Certain Credit Support Issues
Although HIH and our Company are unrestricted subsidiaries of Huntsman LLC, we have not guaranteed or provided any other credit support to Huntsman LLC under its credit facilities (the "HLLC Credit Facilities") or the outstanding notes of Huntsman LLC, and Huntsman LLC has not guaranteed or provided any other credit support to our obligations under the HI Credit Facilities or our notes. Events of default under the HI Credit Facilities, or under our notes or the exercise of any remedy by the lenders thereunder will not cause any cross-defaults or cross-accelerations under the HLLC Credit Facilities or Huntsman LLC's outstanding notes. Additionally, any events of default under the HLLC Credit Facilities or Huntsman LLC's notes or the exercise of any remedy by the lenders thereunder will not cause any cross-defaults or cross-accelerations under the HI Credit Facilities or our outstanding notes, except insofar as foreclosure on the stock of Huntsman Specialty Chemical Holdings Corporation, the stock of Huntsman Specialty or the HIH Membership Interests pledged to secure Huntsman LLC's obligations under the HLLC Credit Facilities or the Huntsman LLC notes, would constitute a "change of control" and an event of default under the HI Credit Facilities and would give certain put rights to the holders of our outstanding notes.
46
On May 9, 2003, HMP issued 15% senior secured discount notes due 2008 (the "HMP Senior Discount Notes") with an accreted value of $423 million. Interest is paid in kind. The HMP Senior Discount Notes are secured by a first priority lien on the 8% senior subordinated discount reset notes due 2009 of HIH acquired by HMP in connection with the HIH Consolidation Transaction, the 10% direct and 30% indirect equity interests held by HMP in HIH, HMP's common stock outstanding as of May 9, 2003, and HMP's 100% equity interest in Huntsman LLC. A payment default under the HMP Senior Discount Notes, or any other default that would permit the holders to accelerate the unpaid balance thereunder, would also constitute a default under the HLLC Credit Facilities. Foreclosure on the stock of HMP or the equity interest in Huntsman LLC would constitute a "change of control" and an event of default under the HLLC Credit Facilities and the HI Credit Facilities, and would give certain put rights to the holders of the Huntsman LLC Notes and our notes.
Environmental Matters
General
Our operations are subject to extensive environmental laws and regulations concerning emissions to the air, discharges to surface and subsurface waters, and the generation, handling, storage, transportation, treatment and disposal of waste materials, as adopted by various governmental authorities in the jurisdictions in which we operate. We make every reasonable effort to remain in full compliance with existing governmental regulations. Accordingly, we may incur costs for capital improvements and general compliance under environmental laws, including costs to acquire, maintain and repair pollution control equipment. We cannot provide assurances that material capital expenditures beyond those currently anticipated will not be required under environmental laws.
Environmental Capital Expenditures and Accruals
We have established financial reserves relating to environmental restoration and remediation programs, which we believe are sufficient for known requirements. In connection with various acquisitions, the acquisition agreements generally provide for indemnification for environmental pollution existing on the date of acquisition. Liabilities are recorded when site restoration and environmental remediation and clean-up obligations are either known or considered probable and can be reasonably estimated. Liabilities are based upon all available facts, existing technology, past experience and cost-sharing and indemnification arrangements (as to which, we consider the viability of other parties).
Our capital expenditures relating to environmental matters for the year ended December 31, 2003, were approximately $31 million. Capital costs relating to environmental matters in 2004 are expected to total approximately $40 million. A total of $17.0 million has been accrued related to environmental related liabilities as of December 31, 2003.
Estimates of ultimate future environmental restoration and remediation costs are inherently imprecise due to currently unknown factors such as the magnitude of possible contamination, the timing and extent of such restoration and remediation, the determination of our liability in proportion to other parties, the extent to which such costs are recoverable from insurance, and the extent to which environmental laws and regulations may change in the future. However, it is not anticipated that any future costs, in excess of those that have been accrued by our Company, will be material to our results of operations or financial position as a result of compliance with current environmental laws and regulations.
Potential Liabilities
Given the nature of our business, violations of environmental laws may result in restrictions being imposed on operating activities, substantial fines, penalties, damages or other costs, any of which could
47
have a material adverse effect on our business, financial condition, results of operations or cash flows. We are aware of the following matters:
The Texas Commission on Environmental Quality (the "TCEQ," formerly the Texas Natural Resource Conservation Commission or TNRCC) approved a settlement with Huntsman Petrochemical Corporation effective June 12, 2003 regarding allegations of environmental regulatory violations at our Port Neches, Texas, facilities. The settlement imposes penalties totaling $302,250, of which $7,000 has already been paid. The balance of the penalty is due on June 11, 2005. Additionally, the settlement requires that we apply for an air emissions permit for the joint wastewater treatment plant that services all of the Port Neches facilities. Less than $100,000 of the aforementioned penalties are allocable to our Company. Although management does not anticipate it, it is possible that the terms of a joint wastewater treatment plant air permit may cause us to incur substantial costs that could be material.
On October 6, 2002, a leak of sulphuric acid from two tanks located near our Whitehaven, U.K. plant was discovered. About 342 to 347 tonnes of acid were released onto the ground and into the soil near the tanks. Although we took immediate steps to contain the spillage and recover acid, a quantity of acid reached a nearby beach via a geological fault. We believe that we did not own the tanks; however, we did own the acid in the tanks. The U.K. Environment Agency ("EA") is conducting an investigation that could result in a prosecution being initiated. The U.K. Health and Safety Executive has issued three Improvement Notices requiring corrective action with which we are complying. Although we can give no assurances, based on currently available information and our understanding of similar investigations and penalties in the past, we believe that, if any charges are brought or additional corrective action orders issued and we are ultimately found to be legally responsible, the probable penalties would not be material to our financial position or results of operations.
During 2002 and 2003, we voluntarily removed filter salts from a property previously operated by Almagrera in Spain. Almagrera supplied sulphuric acid to one of our subsidiaries. Under an agreement with Almagrera, our subsidiary had for some time supplied filter salts to Almagrera to be used in the manufacture of sulphuric acid. When Almagrera filed for bankruptcy and closed its plant in 2001, a large quantity of stored filter salts was found on its premises, far from its normal warehouse. We spent $2.2 million to remove and dispose of the salts. The project has been completed.
We are aware that there is or may be soil or groundwater contamination at some of our facilities resulting from past operations. Based on available information and the indemnification rights (including indemnities provided by Huntsman Specialty, ICI, Rohm and Haas, Rhodia and Dow Chemical, for the facilities that each of them transferred to us), we believe that the costs to investigate and remediate known contamination will not have a material adverse effect on our financial condition, results of operations or cash flows; however, we cannot give any assurance that such indemnities will fully cover the costs of investigation and remediation, that we will not be required to contribute to such costs or that such costs will not be material.
By a Notice of Enforcement letter dated March 6, 2003, we were notified by the TCEQ of a probable enforcement action arising out of the inspection of the Freeport, Texas facility on December 16-19, 2002. Seven types of violations relating to the Texas Clean Air Act requirements were cited. After extensive communications with the TCEQ regarding the validity of the allegations, the TCEQ determined that the imposition of penalties was inappropriate. This matter has been dropped.
Under the EU Integrated Pollution Prevention and Control Directive ("IPPC"), EU member governments are to adopt rules and implement a cross-media (air, water, waste) environmental permitting program for individual facilities. The UK was the first EU member government to request IPPC permit applications from us. In the UK, we have submitted several applications and, very recently, negotiated and received our first IPPC permits. Based upon the terms of these permits, we do not anticipate that we will have to make material capital expenditures to comply. Other IPPC permits are under review by the UK Environment Agency. We are not yet in a position to know with certainty
48
what the other UK IPPC permits will require, and it is possible that the costs of compliance could be material; however, we believe, based upon our experience to date, that the costs of compliance with IPPC permitting in the UK will not be material to our financial condition or results of operations. Additionally, the IPPC directive has recently been implemented in France, and like our operations in the UK, we do not anticipate having to make material capital expenditures to comply.
With respect to our facilities in other EU jurisdictions, IPPC implementing legislation is not yet in effect, or we have not yet been required to seek IPPC permits. Accordingly, while we expect to incur additional future costs for capital improvements and general compliance under IPPC requirements in these jurisdictions, at the present time we are unable to determine whether or not these costs will be material. Accordingly, we cannot provide assurance that material capital expenditures and compliance costs will not be required in connection with IPPC requirements.
MTBE Developments
The use of MTBE is controversial in the United States and elsewhere and may be substantially curtailed or eliminated in the future by legislation or regulatory action. The presence of MTBE in some groundwater supplies in California and other states (primarily due to gasoline leaking from underground storage tanks) and in surface water (primarily from recreational watercraft) has led to public concern about MTBE's potential to contaminate drinking water supplies. Heightened public awareness regarding this issue has resulted in state, federal and foreign initiatives to rescind the federal oxygenate requirements for reformulated gasoline or restrict or prohibit the use of MTBE in particular. For example, the California Air Resources Board adopted regulations that prohibit the addition of MTBE to gasoline as of January 1, 2004. Certain other states have also taken actions to restrict or eliminate the future use of MTBE. In connection with its ban, the State of California requested that the EPA waive the federal oxygenated fuels requirements of the federal Clean Air Act for gasoline sold in California. The EPA denied the State's request on June 12, 2001. Certain of the state bans, including California's ban, have been challenged in court as unconstitutional (in light of the Clean Air Act). On June 4, 2003, a federal court of appeals rejected such a challenge to California's ban, ruling that the ban is not pre-empted by the Clean Air Act.
Bills have been introduced in the U.S. Congress to curtail or eliminate the oxygenated fuels requirements in the Clean Air Act, or curtail MTBE use. To date, no such legislation has become law, but such legislation is being considered by Congress and could result in a federal ban on the use of MTBE in gasoline. In addition, on March 20, 2000, the EPA announced its intention, through an advanced notice of proposed rulemaking, to phase out the use of MTBE under authority of the federal Toxic Substances Control Act. In its notice, the EPA also called on the U.S. Congress to restrict the use of MTBE under the Clean Air Act.
In Europe, the EU issued a final risk assessment report on MTBE on September 20, 2002. While no ban of MTBE was recommended, several risk reduction measures relating to storage and handling of MTBE-containing fuel were recommended. Separate from EU action, Denmark entered into a voluntary agreement with refiners to reduce the sale of MTBE in Denmark. Under the agreement, use of MTBE in 92- and 95-octane gasoline in Denmark ceased by May 1, 2002; however, MTBE is still an additive in a limited amount of 98-octane gasoline sold in about 100 selected service stations in Denmark.
Any phase-out or other future regulation of MTBE in other states, nationally or internationally may result in a significant reduction in demand for our MTBE and result in a material loss in revenues or material costs or expenditures. In the event that there should be a phase-out of MTBE in the United States, we believe we will be able to export MTBE to Europe or elsewhere or use its co-product TBA to produce saleable products other than MTBE. We believe that our low production costs at the PO/MTBE facility will put us in a favorable position relative to other higher cost sources
49
(primarily, on-purpose manufacturing). If we opt to produce products other than MTBE, necessary modifications to our facilities may require significant capital expenditures and the sale of the other products may produce a materially lower level of cash flow than the sale of MTBE.
In addition, while we have not been named as a defendant in any litigation concerning the environmental effects of MTBE, we cannot provide assurances that we will not be involved in any such litigation or that such litigation will not have a material adverse effect on our business, financial condition, results of operations or cash flows. In 2003, the U.S. House of Representatives passed a version of an energy bill that contained limited liability protection for producers of MTBE. The Senate's version of the bill did not have liability protection. The issue was one of the reasons that a compromise energy bill was not passed. Whether a compromise will be reached on this legislation in 2004, and whether any compromise will provide liability protection for producers, are unknown. In any event, the liability protection provision in the House bill applied only to defective product claims; it would not preclude other types of lawsuits. See "—Cautionary Statement for Forward-Looking Information—Pending or future litigation or legislative initiatives related to MTBE may subject us or our products to environmental liability or materially adversely affect our sales and costs."
REACH Developments
On October 29, 2003, the European Commission adopted a proposal for a new EU regulatory framework for chemicals. Under this proposed new system called "REACH" (Registration, Evaluation and Authorisation of CHemicals), enterprises that manufacture or import more than one ton of a chemical substance per year would be required to register such manufacture or import in a central database. The REACH initiative, as proposed, would require risk assessment of chemicals, preparations (e.g., soaps and paints) and articles (e.g., consumer products) before those materials could be manufactured or imported into EU countries. Where warranted by a risk assessment, hazardous substances would require authorizations for their use. This regulation could impose risk control strategies that would require capital expenditures by our Company. As proposed, REACH would take effect in stages over the next decade. The impacts of REACH on the chemical industry and on us are unclear at this time because the parameters of the program are still being actively debated. Nevertheless, it is possible that REACH, if implemented, would be costly to us.
50
Changes in Financial Condition
The following information summarizes our working capital position as of December 31, 2003 and December 31, 2002 (dollars in millions):
| |
December 31, 2003 |
December 31, 2002 |
Difference |
|||||||||
|---|---|---|---|---|---|---|---|---|---|---|---|---|
| Current assets: | ||||||||||||
| Cash and cash equivalents | $ | 97.8 | $ | 75.4 | $ | 22.4 | ||||||
| Accounts receivable | 564.4 | 473.9 | 90.5 | |||||||||
| Inventories | 596.9 | 561.3 | 35.6 | |||||||||
| Prepaid expenses | 23.6 | 22.0 | 1.6 | |||||||||
| Deferred income taxes | 3.0 | 31.2 | (28.2 | ) | ||||||||
| Other current assets | 83.6 | 69.4 | 14.2 | |||||||||
| Total current assets | 1,369.3 | 1,233.2 | 136.1 | |||||||||
| Current liabilities: | ||||||||||||
| Accounts payable | 561.3 | 568.7 | (7.4 | ) | ||||||||
| Accrued liabilities | 387.7 | 298.6 | 89.1 | |||||||||
| Current portion of long-term debt | 1.8 | 43.9 | (42.1 | ) | ||||||||
| Total current liabilities | 950.8 | 911.2 | 39.6 | |||||||||
| Working capital | $ | 418.5 | $ | 322.0 | $ | 96.5 | ||||||
As of December 31, 2003, our working capital increased by $96.5 million as a result of the net impact of the following significant changes:
51
The preparation of financial statements and related disclosures in conformity with accounting principles generally accepted in the United States of America requires management to make judgments, estimates and assumptions that affect the reported amounts in the consolidated financial statements. Our significant accounting policies are summarized in "Note 2—Summary of Significant Accounting Policies" to our consolidated financial statements. Summarized below are our critical accounting policies:
Long-Lived Assets
The determination of useful lives of our property, plant and equipment is considered a critical accounting estimate. Such lives are estimated based upon our historical experience, engineering estimates and industry information and are reviewed when economic events indicate that we may not be able to recover the carrying value of the assets. The estimated lives of our property range from 3 to 30 years and depreciation is recorded on the straight line method. Inherent in our estimates of useful lives is the assumption that periodic maintenance and an appropriate level of annual capital expenditures will be performed. Without on-going capital improvements and maintenance, the productivity and cost efficiency declines and the useful lives of our assets would be shorter.
We are required to evaluate our plant assets whenever events indicate that the carrying value may not be recoverable in the future or when management's plans change regarding those assets, such as idling or closing a plant. We evaluate impairment by comparing undiscounted cash flows of the related property to the carrying value. Key assumptions in determining the future cash flows include the useful life, technology, competitive pressures, raw material pricing and regulations.
Restructuring and Plant Closing Costs
We have recorded restructuring charges in recent years in connection with closing certain plant locations, work force reductions and other cost savings programs. These charges are recorded when management has committed to a plan and incurred a liability related to the plan. Estimates for plant closing include the write-off of the carrying value of the plant, any necessary environmental and/or regulatory costs, contract termination and demolition costs. Estimates for work force reductions and other cost savings are recorded based upon estimates of the number of positions to be terminated, termination benefits to be provided and other information as necessary. Management evaluates the estimates on a quarterly basis and adjusts the reserve when information indicates that the estimate is above or below the initial estimate.
Income Taxes
Deferred income taxes are provided for temporary differences between financial statement income and taxable income using the asset and liability approach. We have significant NOLs in various foreign jurisdictions. While the majority of the NOLs have no expiration date, certain NOLs have a limited life and begin to expire in 2006. We record valuation allowances based upon our evaluation of positive and negative evidence about realization of such deferred tax assets. Such evaluations require us to consider future taxable income in the related jurisdictions. Significant judgment is required due to the nature of our operations and the complexity of the numerous tax jurisdictions in which we operate. As of December 31, 2003, we have provided a valuation allowance of $64.5 million to reduce the deferred tax asset related to NOLs to the amount that we expect to be realized.
52
Employee Benefit Programs
We sponsor various contributory and non-contributory defined benefit plans covering employees in the U.S., U.K., Netherlands, Belgium, Canada and a number of other countries. We fund the material plans through trust arrangements (or local equivalents) where the assets are held separately from the employer. We also sponsor unfunded post-retirement plans which provide medical and life insurance benefits covering certain employees in the U.S. and Canada. Amounts recorded in the consolidated financial statements are recorded based upon actuarial valuations performed by various independent actuaries. Inherent in these valuations are numerous assumptions regarding expected return on assets, discount rates, compensation increases, mortality rates and health care costs trends. These assumptions are disclosed in the notes to the consolidated financial statements.
During 2003, we revised our expected return on plan assets and rate of compensation increases for our defined benefit plans to 7.29% from 7.00% and to 3.76% from 3.39% respectively, and the discount rate on our defined benefit plans and expected healthcare trend rate in the next four years for our other post retirement benefit plans to 6.25% from 6.62% and to 11% from 10%, respectively, as a result of current economic conditions based upon discussions with our actuaries, the historical long-term returns of our pension assets, recent market information related to interest rates and equity performance.
Environmental Reserves
Environmental remediation costs for our facilities are accrued when it is probable that a liability has been incurred and the amount can be reasonably estimated. Estimates of environmental reserves require evaluating government regulation, available technology, site-specific information and remediation alternatives. We accrue an amount equal to our best estimate of the costs to remediate based upon the available information. Adjustments to our estimates are made periodically based upon additional information received as remediation progresses. For further information see "Item 1—Business—Environmental Regulation" and "Note 18—Environmental Matters" to the consolidated financial statements.
Recently Issued Financial Accounting Standards
In January 2003, the Financial Accounting Standards Board ("FASB") issued FIN No. 46, "Consolidation of Variable Interest Entities." FIN No. 46 addresses the requirements for business enterprises to consolidate related entities, for which they do not have controlling interests through voting or other rights, if they are determined to be the primary beneficiary as a result of variable economic interests. Transfers to a qualifying special purpose entity are not subject to this interpretation. In December 2003, the FASB issued a complete replacement of FIN No. 46 (FIN No. 46R), which clarified certain complexities and generally requires adoption no later than March 31, 2004 for all entities other than special purpose entities under previous guidance. We are currently evaluating the impact of adopting FIN No. 46R.
Cautionary Statement for Forward-Looking Information
Certain information set forth in this report contains "forward-looking statements" within the meaning of the federal securities laws. Forward-looking statements include statements concerning our plans, objectives, goals, strategies, future events, future revenues or performance, capital expenditures, financing needs, plans or intentions relating to acquisitions and other information that is not historical information. In some cases, forward-looking statements can be identified by terminology such as "believes," "expects," "may," "will," "should," "anticipates," or "intends" or the negative of such terms or other comparable terminology, or by discussions of strategy. We may also make additional forward-
53
looking statements from time to time. All such subsequent forward-looking statements, whether written or oral, by us or on our behalf, are also expressly qualified by these cautionary statements.
All forward-looking statements, including without limitation, management's examination of historical operating trends, are based upon our current expectations and various assumptions. Our expectations, beliefs and projections are expressed in good faith and we believe there is a reasonable basis for them, but, there can be no assurance that management's expectations, beliefs and projections will result or be achieved. All forward-looking statements apply only as of the date made. We undertake no obligation to publicly update or revise forward-looking statements which may be made to reflect events or circumstances after the date made or to reflect the occurrence of unanticipated events.
There are a number of risks and uncertainties that could cause our actual results to differ materially from the forward-looking statements contained in or contemplated by this report. The following are among the factors that could cause actual results to differ materially from the forward-looking statements. There may be other factors, including those discussed elsewhere in this report, that may cause our actual results to differ materially from the forward-looking statements. Any forward-looking statements should be considered in light of all such factors.
Demand for some of our products is cyclical and we may experience prolonged depressed market conditions for our products.
A substantial portion of our revenue is attributable to sales of commodity products, including most of the products of our Base Chemicals and Pigments businesses which generated approximately 44% of our revenue for the year ended December 31, 2003. Historically, the prices for our commodity products have been cyclical and sensitive to relative changes in supply and demand, the availability and price of feedstocks and general economic conditions. Our other products may be subject to these same factors, but, typically, the impact of these factors is greatest on our commodity products.
Historically, the markets for many of our products, particularly our commodity products, have experienced alternating periods of tight supply, causing prices and profit margins to increase, followed by periods of capacity additions, resulting in oversupply and declining prices and profit margins. Currently, several of our markets are experiencing periods of oversupply, and the pricing of our products in these markets is depressed. We cannot guarantee that future growth in demand for these products will be sufficient to alleviate any existing or future conditions of excess industry capacity or that such conditions will not be sustained or further aggravated by anticipated or unanticipated capacity additions or other events.
In addition, sales of certain of our products, particularly ethylene and propylene in our Base Chemicals business, are, and historically have been, dependent upon the continued demand from several key customers. This is a common characteristic in the Base Chemicals business. Six customers are expected to account for over 75% of our ethylene sales in 2004 and four customers are expected to account for over 85% of our propylene sales in 2004. Accordingly, the loss of any of our key Base Chemicals customers could have a material adverse effect on our business and results of operations.
A major customer of our Base Chemicals business has indicated that, upon termination of our existing contract as of December 31, 2005, it will discontinue purchasing ethylene and propylene from us. We expect this customer to purchase approximately 20% of our 2004 ethylene production and approximately 19% of our 2004 propylene production pursuant to the contract which will terminate December 31, 2005. We believe the expected market conditions in Europe for ethylene and propylene will be such that we will be able to sell, upon expiration of the contract, a substantial portion of the ethylene and propylene such customer historically purchased at prices that generate margins comparable to those historically obtained on sales to such customer. However, if market demand for ethylene or propylene in Europe is weaker than expected, we may experience difficulty in selling the ethylene and propylene historically purchased by such customer, or we may have difficulty selling such
54
ethylene and propylene at comparable margins. Failure to place the ethylene or propylene, or the failure to receive comparable margins for such ethylene and propylene, could have a material adverse effect on our business and results of operations.
We have substantial debt that we may be unable to service and that restricts our activities, which could adversely affect our ability to meet our obligations.
As of December 31, 2003, we had total outstanding indebtedness of $2,927.1 million (including the current portion of long-term debt) and a debt to total capitalization ratio of approximately 72%. We require substantial capital to finance our operations and continued growth, and we may incur substantial additional debt from time to time for a variety of purposes. However, the indentures governing our outstanding senior notes and senior subordinated notes and our senior secured credit facilities all contain restrictive covenants. Among other things, these covenants limit or prohibit our ability to incur more debt; make prepayments of other debt, including our senior notes and senior subordinated notes, in whole or in part; pay dividends, redeem stock or make other distributions; issue capital stock; make investments; create liens; enter into transactions with affiliates; enter into sale and leaseback transactions; and merge or consolidate and transfer or sell assets. Additionally, our senior secured credit facilities provide that we will not, and will not permit any of our subsidiaries to, amend, modify or terminate any provisions of our senior notes or senior subordinated notes. Also, if we undergo a change of control, the indentures governing our outstanding senior notes and senior subordinated notes require us to make an offer to purchase the notes. Under these circumstances, we may also be required to repay indebtedness under our senior secured credit facilities to the extent of the value of the assets securing such indebtedness. In this event, we may not have the financial resources necessary to purchase our notes or repay indebtedness under our senior secured credit facilities, which would result in an event of default.
The degree to which we have outstanding debt could have important consequences for our business, including:
We have no scheduled principal payments under our senior secured credit facilities until the second quarter 2005. In each of 2005 and 2006, our scheduled principal payments under the HI Credit Facilities are approximately $12 million per annum. Our $400 million HI Revolving Facility matures in June 2005. Our ability to make scheduled payments of principal and interest on, or to refinance, our debt depends on our future financial performance, which, to a certain extent, is subject to economic, competitive, regulatory and other factors beyond our control. We cannot guarantee that we will have sufficient cash from our operations or other sources to service our debt. If our cash flow and capital resources are insufficient to fund our debt service obligations, we may be forced to reduce or delay capital expenditures, sell assets or seek to obtain additional equity capital or restructure or refinance our debt. We cannot guarantee that such alternative measures would be successful or would permit us to meet our scheduled debt service obligations. In the absence of operating results and resources, we could face substantial liquidity problems and might be required to dispose of material assets or
55
operations to meet our debt service obligations. We cannot guarantee our ability to consummate any asset sales or that any proceeds from an asset sale would be sufficient to meet the obligations then due.
If we are unable to generate sufficient cash flow and we are unable to obtain the funds required to meet payments of principal and interest on our indebtedness, or if we otherwise fail to comply with the various covenants in the instruments governing our indebtedness, including those under our senior secured credit facilities and the indentures governing our outstanding senior notes and senior subordinated notes, we could be in default under the terms of those agreements. In the event of a default by us, a holder of the indebtedness could elect to declare all of the funds borrowed under those agreements to be due and payable together with accrued and unpaid interest, the lenders under our senior secured credit facilities could elect to terminate their commitments thereunder and we could be forced into bankruptcy or liquidation. Any default under the agreements governing our indebtedness could have a material adverse effect on our ability to pay principal and interest on the notes and on the market value of the notes.
If our subsidiaries do not make sufficient distributions to us, then we will not be able to make payment on our debt.
Our debt is the exclusive obligation of our Company and any guarantors thereof and not of any of our other subsidiaries. Because a significant portion of our operations are conducted by our subsidiaries, our cash flow and our ability to service indebtedness, are dependent to a large extent upon cash dividends and distributions or other transfers from our subsidiaries. Any payment of dividends, distributions, loans or advances by our subsidiaries to us could be subject to restrictions on dividends or repatriation of earnings under applicable local law, monetary transfer restrictions and foreign currency exchange regulations in the jurisdictions in which our subsidiaries operate, and any restrictions imposed by the instruments governing the debt of our subsidiaries, which at the present time is not significant. In addition, payments to us by our subsidiaries are contingent upon our subsidiaries' earnings.
Our subsidiaries are separate and distinct legal entities and, except for the guarantors of our notes, have no obligation, contingent or otherwise, to pay any amounts due pursuant to our debt or to make any funds available therefore, whether by dividends, loans, distributions or other payments, and do not guarantee the payment of interest on, or principal of, our debt. Any right that we have to receive any assets of any of our subsidiaries that are not guarantors upon the liquidation or reorganization of any such subsidiary, and the consequent right of holders of our debt to realize proceeds from the sale of their assets, will be junior to the claims of that subsidiary's creditors, including trade creditors and holders of debt issued by that subsidiary. In addition, the guarantees of our debt are subordinated to all indebtedness of each guarantor that is secured to the extent of the value of the assets securing such indebtedness.
Significant price volatility of raw materials or disruptions in the availability of raw materials may result in increased costs that we may not be able to pass on to our customers.
The prices for a large portion of our raw materials may be subject to significant volatility. While we frequently enter into supply agreements, as is the general practice in our industries, these agreements typically provide for market-based pricing. As a result, our supply agreements provide only limited protection against price volatility. In addition, the commodity markets for our raw materials may be subject to disruptions. If our suppliers are unable to meet their obligations under applicable supply agreements or we otherwise are unable to obtain efficiently priced raw materials, our business may be disrupted. In the case of either raw material price increases or supply disruptions, we could incur significant additional costs. While we attempt to match cost increases with corresponding product price increases, we are not always able to immediately raise product prices, and, ultimately, our ability to pass on underlying cost increases to our customers is greatly dependent upon market conditions. Any
56
underlying cost increase that we are not able to pass on to our customers could have a material adverse effect on our business, financial condition, results of operations or cash flows.
The industries in which we compete are highly competitive and we may not be able to compete effectively with our competitors that are larger and have greater resources.
The industries in which we operate are highly competitive. Among our competitors are some of the world's largest chemical companies and major integrated petroleum companies that have their own raw material resources. Some of these companies may be able to produce products more economically than we can. In addition, many of our competitors are larger and have greater financial resources, which may enable them to invest significant capital into their businesses, including expenditures for research and development. If any of our current or future competitors develop proprietary technology that enables them to produce products at a significantly lower cost, our technology could be rendered uneconomical or obsolete. Moreover, certain of our businesses use technology that is widely available. Accordingly, barriers to entry, apart from capital availability, are low in certain product segments of our business, and the entrance of new competitors into the industry may reduce our ability to capture improving profit margins in circumstances where capacity utilization in the industry is increasing. Further, petroleum-rich countries have become more significant participants in the petrochemical industry and may expand this role significantly in the future. Any of these developments would have a significant impact on our ability to enjoy higher profit margins during periods of increased demand. See "—Cautionary Statement for Forward-Looking Information—Demand for some of our products is cyclical and we may experience prolonged depressed market conditions for our products."
Our ability to repay our debt may be adversely affected if our joint venture partners do not perform their obligations or we have disagreements with them.
We conduct a substantial amount of our operations through our joint ventures. Our ability to meet our debt service obligations depends, in part, upon the operation of our joint ventures. If any of our joint venture partners fails to observe its commitments, that joint venture may not be able to operate according to its business plans or we may be required to increase our level of commitment to give effect to those plans. In general, joint venture arrangements may be affected by relations between the joint venture partners. Differences in views among the partners may, for example, result in delayed decisions or in failure to agree on significant matters. Such circumstances may have an adverse effect on the business and operations of the joint ventures, adversely affecting the business and operations of our Company. If we cannot agree with our joint venture partners on significant issues, we may experience a material adverse effect on our business, financial condition, results of operations or cash flows.
Terrorist attacks, such as the attacks that occurred on September 11, 2001, the current military action in Iraq, general instability in various OPEC member nations and the threat of prolonged military action in Iraq and other attacks or acts of war in the United States and abroad may adversely affect the markets in which we operate, our operations and our profitability.
The attacks of September 11, 2001 and subsequent events, including the current military action in Iraq, have caused instability in the United States and other financial markets and have led, and may continue to lead to, further armed hostilities, prolonged military action in Iraq, or further acts of terrorism in the United States or abroad, which could cause further instability in financial markets. Current regional tensions and conflicts in various OPEC member nations, including the current military action in Iraq, have caused, and may continue to cause, escalated raw material costs, specifically raising the prices of oil and gas, which are used in our operations. In addition, the uncertainty surrounding the current military action in Iraq and the threat of further armed hostilities or acts of terrorism may impact any or all of our physical facilities and operations, which are located in Europe, North America,
57
Australia, Asia, Africa, South America, and the Middle East, or those of our customers. Furthermore, the terrorist attacks, subsequent events and future developments in any of these areas may result in reduced demand from our customers for our products. These developments will subject our worldwide operations to increased risks and, depending on their magnitude, could have a material adverse effect on our business, financial condition, results of operations or cash flows.
Pending or future litigation or legislative initiatives related to MTBE may subject us or our products to environmental liability or materially adversely affect our sales and costs.
The use of MTBE is controversial in the United States and elsewhere and may be substantially curtailed or eliminated in the future by legislation or regulatory action. The presence of MTBE in some groundwater supplies in California and other states (primarily due to gasoline leaking from underground storage tanks) and in surface water (primarily from recreational watercraft) has led to public concern about MTBE's potential to contaminate drinking water supplies. Heightened public awareness regarding this issue has resulted in state, federal and foreign initiatives to rescind the federal oxygenate requirements for reformulated gasoline or restrict or prohibit the use of MTBE in particular. For example, the California Air Resources Board adopted regulations that prohibit the addition of MTBE to gasoline as of January 1, 2004. Certain other states have also taken actions to restrict or eliminate the future use of MTBE. In connection with its ban, the State of California requested that the EPA waive the federal oxygenated fuels requirements of the federal Clean Air Act for gasoline sold in California. The EPA denied the State's request on June 12, 2001. Certain of the state bans, including California's ban, have been challenged in court as unconstitutional (in light of the Clean Air Act). On June 4, 2003, a federal court of appeals rejected such a challenge to California's ban, ruling that the ban is not pre-empted by the Clean Air Act.
Bills have been introduced in the U.S. Congress to curtail or eliminate the oxygenated fuels requirements in the Clean Air Act, or curtail MTBE use. To date, no such legislation has become law, but such legislation is being considered by Congress and could result in a federal ban on the use of MTBE in gasoline. In addition, on March 20, 2000, the EPA announced its intention, through an advanced notice of proposed rulemaking, to phase out the use of MTBE under authority of the federal Toxic Substances Control Act. In its notice, the EPA also called on the U.S. Congress to restrict the use of MTBE under the Clean Air Act.
In Europe, the EU issued a final risk assessment report on MTBE on September 20, 2002. While no ban of MTBE was recommended, several risk reduction measures relating to storage and handling of MTBE-containing fuel were recommended. Separate from EU action, Denmark entered into a voluntary agreement with refiners to reduce the sale of MTBE in Denmark. Under the agreement, use of MTBE in 92- and 95-octane gasoline in Denmark ceased by May 1, 2002; however, MTBE is still an additive in a limited amount of 98-octane gasoline sold in about 100 selected service stations in Denmark.
Any phase-out or other future regulation of MTBE in other states, nationally or internationally may result in a significant reduction in demand for our MTBE and result in a material loss in revenues or material costs or expenditures. In the event that there should be a phase-out of MTBE in the United States, we believe we will be able to export MTBE to Europe or elsewhere or use its co-product TBA to produce saleable products other than MTBE. We believe that our low production costs at our PO/MTBE facility will put us in a favorable position relative to other higher cost sources (primarily, on-purpose manufacturing). If we opt to produce products other than MTBE, necessary modifications to our facilities may require significant capital expenditures and the sale of the other products may produce a materially lower level of cash flow than the sale of MTBE.
In addition, while we have not been named as a defendant in any litigation concerning the environmental effects of MTBE, we cannot provide assurances that we will not be involved in any such
58
litigation or that such litigation will not have a material adverse effect on our business, financial condition, results of operations or cash flows. In 2003, the U.S. House of Representatives passed a version of an energy bill that contained limited liability protection for producers of MTBE. The Senate's version of the bill did not have liability protection. The issue was one of the reasons that a compromise energy bill was not passed. Whether a compromise will be reached on this legislation in 2004, and whether any compromise will provide liability protection for producers, are unknown. In any event, the liability protection provision in the House bill applied only to defective product claims; it would not preclude other types of lawsuits. For additional information on recent developments concerning MTBE, see "Business—Polyurethanes—MTBE Developments."
If we are unable to maintain our relationships with Huntsman LLC then we may not be able to replace on favorable terms our contracts with them or the services and facilities that they provide, if at all.
We have entered and will continue to enter into certain agreements, including service, supply and purchase contracts with Huntsman LLC. If Huntsman LLC or any of its affiliates fail to perform their obligations under any of these agreements, or if any of these agreements terminate or we are otherwise unable to obtain the benefits thereunder for any reason, there could be a material adverse effect on our business, financial condition, results of operations or cash flows if we are unable to obtain similar service, supply or purchase contracts on the same terms from third parties. For example, we have only one operating facility for our production of PO, which is located in Port Neches, Texas. The facility is dependent on the existing infrastructure and adjacent facilities of Huntsman LLC for certain utilities, raw materials, product distribution systems and safety systems. In addition, we depend upon employees of Huntsman LLC to operate our Port Neches facility. We purchase all of the propylene used in the production of PO through Huntsman LLC's pipeline, which is the only existing propylene pipeline connected to our PO facility. If we were required to obtain propylene from another source, we would need to make a substantial investment in an alternative pipeline. This could have a material adverse effect on our business, financial condition, results of operations or cash flows.
We are subject to many environmental and safety regulations that may result in unanticipated costs or liabilities.
We are subject to extensive federal, state, local and foreign laws, regulations, rules and ordinances relating to pollution, the protection of the environment and the use or cleanup of hazardous substances and wastes. We may incur substantial costs, including fines, damages and criminal or civil sanctions, or experience interruptions in our operations for actual or alleged violations or compliance requirements arising under environmental laws. Our operations could result in violations of environmental laws, including spills or other releases of hazardous substances to the environment. In the event of a significant incident, we could incur material costs.
Given the nature of our business, violations of environmental laws may result in restrictions imposed on our operating activities, substantial fines, penalties, damages or other costs, any of which could have a material adverse effect on our business, financial condition, results of operations or cash flows. We know of several pending matters involving alleged violations of environmental law that may result in penalties over $100,000. These matters are discussed in "Management's Discussion and Analysis of Financial Condition and Results of Operations—Environmental Matters."
In addition, we could incur significant expenditures in order to comply with existing or future environmental or safety laws. Capital expenditures and, to a lesser extent, costs and operating expenses relating to environmental or safety matters will be subject to evolving regulatory requirements and will depend on the timing of the promulgation and enforcement of specific standards which impose requirements on our operations. Accordingly, we cannot provide assurances that capital expenditures beyond those currently anticipated will not be required under existing or future environmental or safety
59
laws. See "Management's Discussion and Analysis of Financial Condition and Results of Operations—Environmental Matters."
We have planned capital expenditures to comply with national legislation implementing IPPC. Under IPPC, EU member governments are to adopt rules and implement a cross-media (air, water, waste) environmental permitting program for individual facilities. The UK was the first EU member government to request IPPC permit applications from us. In the UK, we have submitted several applications and, very recently, negotiated and received our first IPPC permits. Based upon the terms of these permits, we do not anticipate that we will have to make material capital expenditures to comply. Other IPPC permits are under review by the UK Environment Agency. We are not yet in a position to know with certainty what the other UK IPPC permits will require, and it is possible that the costs of compliance could be material; however, we believe, based upon our experience to date, that the costs of compliance with IPPC permitting in the UK will not be material to our financial condition or results of operations. Additionally, the IPPC directive has recently been implemented in France, and like our operations in the UK, we do not anticipate having to make material capital expenditures to comply. With respect to our facilities in other EU jurisdictions, IPPC implementing legislation is not yet in effect, or we have not yet been required to seek IPPC permits. Accordingly, while we expect to incur additional future costs for capital improvements and general compliance under IPPC requirements in these jurisdictions, at the present time we are unable to determine whether or not these costs will be material. Accordingly, we cannot provide assurance that material capital expenditures and compliance costs will not be required in connection with IPPC requirements. See "Management's Discussion and Analysis of Financial Condition and Results of Operations."
Furthermore, we may be liable for the costs of investigating and cleaning up environmental contamination on or from our properties or at off-site locations where we disposed of or arranged for the disposal or treatment of hazardous wastes or from disposal activities that pre-dated the purchase of our businesses. Based on available information and the contractual rights that we possess to seek indemnification from third parties with respect to certain environmental issues, we believe that the costs to investigate and remediate known contamination will not have a material adverse effect on our business, financial condition, results of operations or cash flows. However, if significant previously unknown contamination is discovered, if existing laws change or if our indemnities do not cover the costs of investigation and remediation, then such expenditures could have a material adverse effect on our business, financial condition, results of operations or cash flows. See "Business—Environmental Regulation."
Our business may be adversely affected by international operations and fluctuations in currency exchange rates.
We conduct a significant portion of our business outside the United States. Our operations outside the United States are subject to risks normally associated with international operations. These risks include the need to convert currencies which we may receive for our products into currencies required to pay our debt, or into currencies in which we purchase raw materials or pay for services, which could result in a gain or loss depending on fluctuations in exchange rates. Other risks of international operations include trade barriers, tariffs, exchange controls, national and regional labor strikes, social and political risks, general economic risks, required compliance with a variety of foreign laws, including tax laws and the difficulty of enforcing agreements and collecting receivables through foreign legal systems.
Our business is dependent on our intellectual property. If our patents are declared invalid or our trade secrets become known to our competitors, our ability to compete may be adversely affected.
Proprietary protection of our processes, apparatuses, and other technology is important to our business. Consequently, we rely on judicial enforcement for protection of our patents. While a
60
presumption of validity exists with respect to patents issued to us in the United States, there can be no assurance that any of our patents will not be challenged, invalidated, circumvented or rendered unenforceable. Furthermore, if any pending patent application filed by us does not result in an issued patent, or if patents are issued to us, but such patents do not provide meaningful protection of our intellectual property, then the use of any such intellectual property by our competitors could have a material adverse effect on our business, financial condition, results of operations or cash flows. Additionally, our competitors or other third parties may obtain patents that restrict or preclude our ability to lawfully produce or sell our products in a competitive manner, which could have a material adverse effect on our business, financial condition, results of operations or cash flows.
We also rely upon unpatented proprietary know-how and continuing technological innovation and other trade secrets to develop and maintain our competitive position. While it is our policy to enter into confidentiality agreements with our employees and third parties to protect our intellectual property, these confidentiality agreements may be breached, may not provide meaningful protection for our trade secrets or proprietary know-how, or adequate remedies may not be available in the event of an unauthorized use or disclosure of such trade secrets and know-how. In addition, others could obtain knowledge of such trade secrets through independent development or other access by legal means. The failure of our patents or confidentiality agreements to protect our processes, apparatuses, technology, trade secrets or proprietary know-how could have a material adverse effect on our business, financial condition, results of operations or cash flows.
We rely on our key executives to achieve important financial goals.
Our ability to meet our financial goals depends to a large extent on our senior management team and other key executives. The achievement of our financial goals requires significant management time and, to the extent that members of senior management are unavailable, for any reason, including allocation of management time to other companies, such as Huntsman LLC and AdMat, that are now or may become part of the Huntsman Holdings organization, our business could be adversely affected. Although we believe that we could replace senior management within a reasonable period of time, the absence of these key personnel could adversely affect our business.
If we are unable to maintain an effective working relationship with GOP, our business could be adversely affected.
GOP has certain important rights pursuant to the limited liability company agreement of Huntsman Holdings (the "Huntsman Holdings LLC Agreement") and an Interest Holders Agreement among Huntsman Holdings, HGI, HMP, Huntsman LLC, Huntsman Family Holdings Company LLC, and GOP (the "Interest Holders Agreement") that relate to the designation of directors and managers, approval rights with respect to the taking of certain actions, and the initiation of certain sales of all or substantially all the assets or equity of HGI, HMP or Huntsman LLC. Under the Huntsman Holdings LLC Agreement, GOP has the right to designate some, but less than a majority, of the directors or managers, as applicable, of HGI, HMP and Huntsman LLC. GOP also has the right to designate one manager of HIH pursuant to the Interest Holders Agreement and under certain circumstances may acquire the right to designate one manager of our Company. In addition, GOP has the right to prevent our Company from taking certain actions or engaging in certain specified transactions as more fully described in "Security Ownership of Certain Beneficial Owners and Management" below. If we are unable to maintain an effective working relationship with GOP, it could become difficult to take actions that require GOP's approval, which could adversely affect our ability to manage our business.
Certain events could result in a change of control of our Company.
Huntsman LLC has certain term and revolving credit facilities (the "HLLC Credit Facilities"), and has also issued certain senior secured notes (the "HLLC Secured Notes") that are secured, in part, by
61
a pledge of 60% of the equity of HIH. The sale of those pledged interests, whether as a result of a foreclosure under the HLLC Credit Facilities or the HLLC Secured Notes or in connection with a bankruptcy or similar proceedings or otherwise, could result in a change in control of our Company.
HMP issued certain senior discount notes (the "HMP Senior Discount Notes") in connection with its acquisition of the outstanding minority interests of HIH. The HMP Senior Discount Notes are secured by, among other things, a pledge of 40% of the equity interests of HIH, as well as all the equity interests of Huntsman LLC and HMP. In the event of a default under the HMP Senior Discount Notes, the trustee under the indenture governing the HMP Senior Discount Notes could foreclose on the collateral, including those equity interests. Sale of those equity interests, whether as a result of foreclosure or in connection with bankruptcy or similar proceedings or otherwise, could result in a change in control of our Company.
GOP has certain rights under the Huntsman Holdings LLC Agreement, after September 30, 2007, to initiate the sale of all or substantially all of the equity or assets of HGI, HMP or Huntsman LLC. The organizational documents of HGI, HMP, and Huntsman LLC require the directors or managers, as applicable, to take certain actions in order to facilitate any such process. If the directors or managers of HGI, HMP or Huntsman LLC fail to take those actions, GOP will acquire the right to designate a majority of such directors or managers which could result in a change in control of our Company, as could the consummation of any sale contemplated by the foregoing process or otherwise.
A change of control of our Company would be an event of default under the HI Credit Facilities and would give the holders of the Senior Notes and Subordinated Notes the right to require us to purchase their notes at 101% of the aggregate principal amount. There can be no assurance that we would have funds available to complete such purchases.
ITEM 7A. QUANTITATIVE AND QUALITATIVE DISCLOSURES ABOUT MARKET RISKS
We are exposed to market risk, including changes in interest rates, currency exchange rates and certain commodity prices. Our exposure to foreign currency market risk is somewhat limited since our sales prices are typically denominated in euros or U.S. dollars. From time to time, we may enter into foreign currency derivative instruments to minimize the short-term economic impact of movements in foreign currency rates. Our exposure to changing commodity prices is somewhat limited since the majority of our raw materials are acquired at posted or market related prices, and sales prices for finished products are generally at market related prices which are set on a quarterly basis in line with industry practice. To manage the volatility relating to these exposures, from time to time, we enter into various derivative transactions. We hold and issue derivative financial instruments for economic hedging purposes only.
Our cash flows and earnings are subject to fluctuations due to exchange rate variation. Short-term exposures to changing foreign currency exchange rates at certain foreign subsidiaries are first netted with exposures of other subsidiaries and the remaining exposures then, from time to time, may be managed through financial market transactions, principally through the purchase of forward foreign exchange contracts (with maturities of nine months or less) with various financial institutions, to reflect the currency denomination of our cash flows. We do not hedge our currency exposures in a manner that would eliminate the effect of changes in exchange rates on our cash flows and earnings. As of December 31, 2003, we had no outstanding forward foreign exchange contracts with third party banks. Predominantly, our foreign currency hedging activity is to sell forward our surplus non-dollar receivables for U.S. dollars. In addition, our accounts receivable securitization program requires that we enter into certain forward foreign currency hedges intended to hedge currency exposures on the collateral supporting the off-balance sheet debt issued in the program.
Under the terms of the HI Credit Facilities, we are required to hedge a significant portion of our floating rate debt through June 2004. In recent years, we have issued fixed rate debt in the form of the
62
Senior Unsecured Notes that serve as a natural hedge for a portion of our floating rate debt. As of December 31, 2003, we had outstanding approximately $362.7 million notional amount of interest rate swap, cap and collar transactions, which have maturities of nine months or less. The majority of these transactions hedge against movements in U.S. dollar interest rates. The U.S. dollar swap transactions obligate us to pay fixed amounts ranging from approximately 5.0% to approximately 6.91%. The U.S. dollar collar transactions carry floors ranging from 5.0% to 6.25% and caps ranging from 6.75% to 7.25%. We have also entered into a euro-denominated swap transaction that obligates us to pay a fixed rate of approximately 4.31%. We do not hedge our interest rate exposure in a manner that would eliminate the effects of changes in market interest rates on our cash flow and earnings. Assuming a 1.0% (100 basis point) increase in interest rates, without giving effect to interest rate hedges, the effect on the annual interest expense would be an increase of approximately $13 million. This increase would be reduced by approximately $4 million, on an annualized basis, as a result of the effects of the interest rate swap, cap and collar transactions described above.
In order to reduce overall raw material cost volatility, from time to time we enter into various commodity contracts to hedge our purchase of commodity products. We do not hedge our commodity exposure in a manner that would eliminate the effects of changes in commodity prices on our cash flows and earnings. At December 31, 2003, we had forward purchase contracts for 15,000 tonnes of naphtha and 12,000 tonnes of other hydrocarbons, which do not qualify for hedge accounting. Assuming a 10% increase or a 10% decrease in the price per tonne of naphtha, the impact on the forward purchase contracts would result in losses and gains of approximately $0.4 million, respectively.
ITEM 8. FINANCIAL STATEMENTS AND SUPPLEMENTARY DATA
Our Consolidated Financial Statements required by this item are included on the pages immediately following the Index to Consolidated Financial Statements appearing on page F-1.
ITEM 9. CHANGES IN AND DISAGREEMENTS WITH ACCOUNTANTS ON ACCOUNTING AND FINANCIAL DISCLOSURE
There have been no changes in our independent accountants, Deloitte & Touche LLP, or disagreements with them on matters of accounting or financial disclosure.
ITEM 9A. CONTROLS AND PROCEDURES
Our management, with the participation of our chief executive officer and chief financial officer, has evaluated the effectiveness of our disclosure controls and procedures (as defined in Rules 13a-15(e) and 15d-15(e) under the Securities Exchange Act of 1934 (the "Exchange Act")) as of December 31, 2003. Based on this evaluation, our chief executive officer and chief financial officer have concluded that, as of December 31, 2003, our disclosure controls and procedures were (1) designed to ensure that material information relating to our Company, including our consolidated subsidiaries, is made known to the chief executive officer and chief financial officer by others within those entities, particularly during the period in which this report was being prepared, and (2) effective, in that they provide reasonable assurance that information required to be disclosed by our Company in the reports that we file or submit under the Exchange Act are recorded, processed, summarized and reported within the time periods specified in the applicable rules and forms.
In February 2004, we discovered an error in accounting for product exchange balances under toll processing agreement with a customer. The error was caused by the use of an incorrect exchange factor in our new SAP-based ERP system. The use of the incorrect exchange factor resulted from the implementation of and transition to our new SAP-based ERP system in 2003. In investigating this error, we discovered that timely reconciliation of product exchange balances maintained by certain business units was not performed by the business unit's staff, and corporate accounting reviews of such
63
reconciliations were not performed. In response to our discovery of this accounting error and the reconciliation failures, we have implemented improvements to our internal control over financial reporting (as defined in Rules 13a-15(f) and 15d-15(f) under the Exchange Act) in February 2004. These improvements consisted of the implementation of the following policies:
As described in "Note 22—Selected Unaudited Quarterly Financial Data" to the accompanying consolidated financial statements, in March 2004, our management discovered that we had inappropriately calculated foreign exchange gains and losses with respect to our accounts receivable securitization program and had incorrectly classified the foreign exchange gains and losses on the securitized receivables denominated in foreign currency in our consolidated statements of operations for each of the first three quarters of 2003. The use of this inappropriate calculation methodology and the incorrect classification of the foreign exchange gains and losses on the receivables denominated in foreign currency was caused by (i) our accounting group management's lack of understanding of the calculation method employed, (ii) a failure to train the accounting staff personnel responsible for these calculations in the structure of the accounts receivable securitization program and (iii) a failure to properly supervise and review the work of the personnel making these calculations. In response to our discovery of the use of this inappropriate calculation methodology and the management failures, we have implemented improvements to our internal control over financial reporting (as defined in Rules 3a-15(f) and 15d-15(f) under the Exchange Act) in March 2004. These improvements consisted of the following:
Except as described above, no change in our internal control over financial reporting occurred that has materially affected, or is reasonably likely to materially affect, our internal control over financial reporting since the date of the evaluation required by paragraph (d) of Exchange Act Rules 13a-15 or 15d-15.
64
ITEM 10. DIRECTORS AND EXECUTIVE OFFICERS OF THE REGISTRANT
Members of our current board of managers and executive officers are listed below. The members of the board of managers are appointed by the owner of our membership interests and hold office until their successors are duly appointed and qualified. All officers serve at the pleasure of our board of managers.
Board of Managers and Executive Officers
| Name |
Age |
Position |
||
|---|---|---|---|---|
| Jon M. Huntsman(1) | 66 | Chairman of the Board of Managers and Manager | ||
| Peter R. Huntsman(1) | 41 | President, Chief Executive Officer and Manager | ||
| Anthony P. Hankins | 46 | Division President, Polyurethanes | ||
| Thomas J. Keenan | 51 | Division President, Pigments | ||
| Kevin J. Ninow | 40 | Division President, Base Chemicals | ||
| Donald J. Stanutz | 53 | Division President, Performance Products | ||
| J. Kimo Esplin | 41 | Executive Vice President and Chief Financial Officer | ||
| Samuel D. Scruggs | 44 | Executive Vice President, General Counsel and Secretary | ||
| Michael J. Kern | 54 | Senior Vice President, Environmental, Health and Safety and Information Technology | ||
| Don H. Olsen | 57 | Senior Vice President, Global Public Affairs | ||
| Brian V. Ridd | 47 | Senior Vice President, Purchasing | ||
| Sean Douglas | 39 | Vice President and Treasurer | ||
| Curtis C. Dowd | 44 | Vice President | ||
| Kevin C. Hardman | 41 | Vice President, Tax | ||
| L. Russell Healy | 48 | Vice President, Finance | ||
| John R. Heskett | 35 | Vice President, Corporate Development | ||
| Karen H. Huntsman(1) | 66 | Vice President | ||
| Richard H. Johnigan, Jr. | 57 | Vice President and Controller | ||
| James R. Moore | 59 | Vice President and Deputy General Counsel | ||
| Richard Michaelson(2) | 51 | Audit Committee, Chairman | ||
| Christopher Pechock(2) | 39 | Audit Committee | ||
| James A. Huffman(1)(2) | 35 | Audit Committee |
Jon M. Huntsman is Chairman of the Board of Managers of both our Company and HIH and has held those positions since the companies were formed in 1999. Mr. Huntsman has been Chairman of the Board of Directors of Huntsman LLC and all Huntsman companies since he founded his first company in 1970. Mr. Huntsman served as Chief Executive Officer of Huntsman LLC and its affiliated companies from 1970 to 2000, and of our Company and HIH from 1999 to 2000. In addition, Mr. Huntsman serves or has served on numerous corporate and industry boards, including the American Red Cross, The Wharton School, University of Pennsylvania, Primary Children's Medical Center Foundation, the Chemical Manufacturers Association and the American Plastics Council.
65
Mr. Huntsman was selected in 1994 as the chemical industry's top CEO for all businesses in Europe and North America. Mr. Huntsman formerly served as Special Assistant to the President of the United States and as Vice Chairman of the U.S. Chamber of Commerce.
Peter R. Huntsman is President, Chief Executive Officer and a Manager of our Company, HIH, AdMat, Huntsman LLC and many of their subsidiaries. Prior to his appointment in July 2000 as Chief Executive Officer, Mr. Huntsman had served as President, Chief Operating Officer and a Manager of both our Company and HIH since they were formed in 1999. Previously, Mr. Huntsman was Senior Vice President of Huntsman Chemical Corporation and a Senior Vice President of Huntsman Packaging Corporation, a former subsidiary of Huntsman LLC. Mr. Huntsman also served as Vice President—Purchasing, then as Senior Vice President and General Manager for Huntsman Polypropylene Corporation, also a former subsidiary of Huntsman LLC.
Anthony P. Hankins is Division President, Polyurethanes and has held that position since March 11, 2004. Mr. Hankins also serves as Division President, Polyurethanes of Huntsman LLC and HIH. Previously, Mr. Hankins was Global Vice President, Rigids Division for the polyurethanes business of our Company. Mr. Hankins also served as President, Performance Products Division of Huntsman LLC. Mr. Hankins worked for ICI from 1980 to 1999, when he joined our Company. At ICI, Mr. Hankins held numerous management positions in the plastics, fibers and polyurethanes businesses. He has extensive international experience, having held senior management positions in Europe, Asia and the United States.
Thomas J. Keenan is Division President, Pigments. Mr. Keenan also serves as Division President, Pigments of Huntsman LLC and HIH. Previously Mr. Keenan served as President, North American Petrochemicals and Polymers Division of Huntsman Petrochemical Corporation. Mr. Keenan serves or has served in many executive positions with the Huntsman affiliated companies, including Senior Vice President of Huntsman Chemical Company LLC and Huntsman Polymers Corporation. Prior to joining Huntsman in 1994, Mr. Keenan was Vice President and General Manager of Mobil Chemical Company, where he worked for more than sixteen years.
Kevin J. Ninow is Division President, Base Chemicals of our Company and HIH. Mr. Ninow also serves as Division President, Base Chemicals and Polymers of Huntsman LLC. Since joining Huntsman in 1997, Mr. Ninow has served in a variety of executive, manufacturing and engineering positions in our Company and its subsidiaries, including Senior Vice President, Base Chemicals Manufacturing, Vice President European Petrochemicals, Vice President International Manufacturing, Plant Manager—Oxides and Olefins, Plant Manager—C4's, Operations Manager—C4's, Manager of Technology, Process Control Group Leader, and Project Engineer.
Donald J. Stanutz is Division President, Performance Products and has held this position since March 1, 2004. Mr. Stanutz also serves as Division President, Performance Products of Huntsman LLC and HIH. Mr. Stanutz previously served as Executive Vice President and Chief Operating Officer of Huntsman LLC and as Executive Vice President, Global Sales and Marketing and has held several positions with Huntsman that have included the overall management for our performance chemicals business, our specialty polymers business and our olefins, oxides and glycols business. Prior to joining Huntsman in 1994, Mr. Stanutz served in a variety of senior positions with Texaco Chemical Company.
J. Kimo Esplin is Executive Vice President and Chief Financial Officer of our Company, HIH, AdMat and Huntsman LLC. Mr. Esplin has served as chief financial officer of all of the Huntsman companies since 1999. From 1994 to 1999, Mr. Esplin served as our Treasurer. Prior to joining Huntsman in 1994, Mr. Esplin was a Vice President in the Investment Banking Division of Bankers Trust Company, where he worked for seven years. Mr. Esplin also serves as a director of Nutriceutical International Corporation, a publicly traded nutrition supplements company.
66
Samuel D. Scruggs is Executive Vice President, General Counsel and Secretary of our Company, HIH, AdMat and Huntsman LLC. Mr. Scruggs served as our Vice President and Treasurer from 1999 to 2002 and as Executive Vice President from 2002 until he was appointed to his current position in 2003. Mr. Scruggs previously served as Vice President and Associate General Counsel and as Vice President and Treasurer of Huntsman LLC. Prior to joining Huntsman in 1995, Mr. Scruggs was an associate with the law firm of Skadden, Arps, Slate, Meagher & Flom LLP.
Michael J. Kern is Senior Vice President, Environmental, Health and Safety and Information Technology of our Company, HIH, AdMat and Huntsman LLC. Mr. Kern has served in other senior management positions with our Company, including Executive Vice President, Manufacturing, since 1999. Prior to joining Huntsman, Mr. Kern held a variety of positions within Texaco Chemical Company, including Area Manager—Jefferson County Operations from April 1993 until joining our Company, Plant Manager of the Port Neches facility from August 1992 to March 1993, Manager of the PT/MTBE project from October 1989 to July 1992, and manager of Oxides and Olefins from April 1988 to September 1989.
Don H. Olsen is Senior Vice President, Global Public Affairs of our Company, HIH, AdMat and Huntsman LLC. Mr. Olsen also serves as an officer or director of many of our affiliated companies. Prior to joining Huntsman in 1988, Mr. Olsen had a distinguished 17-year career in broadcast journalism. He also spent three years in Washington, D.C. as Director of Communications for former U.S. Senator Jake Garn.
Brian V. Ridd is Senior Vice President, Purchasing. Mr. Ridd has held this position since 2002. Mr. Ridd is also Senior Vice President, Purchasing of Huntsman LLC, HIH and AdMat. Since joining Huntsman in 1984, Mr. Ridd has served as an officer of many Huntsman LLC subsidiaries, including Vice President of Olympus Oil and Vice President, Purchasing of Huntsman Petrochemical Corporation and Huntsman Chemical Corporation.
Sean Douglas is Vice President and Treasurer of our Company, HIH, AdMat, Huntsman LLC and many of their affiliated companies. Since joining Huntsman LLC in 1990, he has served in a number of executive roles, including Vice President Administration and Assistant Treasurer of Huntsman LLC, Vice President of various affiliated companies, Controller of an affiliated company and as a financial analyst for Huntsman's European businesses. Mr. Douglas is a CPA and, prior to joining Huntsman, worked for Price Waterhouse.
Curtis C. Dowd is Vice President of our Company, HIH, AdMat and Huntsman LLC. Mr. Dowd served as Vice President, Surface Sciences from 2001 to 2003 and Vice President, Corporate Development from 1999 through 2001. Mr. Dowd served as Vice President and General Counsel of Huntsman Petrochemical Corporation from 1994 to 1998. Prior to joining Huntsman in 1994, Mr. Dowd was an associate with the law firm of Skadden, Arps, Slate, Meagher & Flom LLP and had spent over six years as a CPA with the accounting firm of Price Waterhouse.
Kevin C. Hardman is Vice President, Tax of our Company, HIH, AdMat and Huntsman LLC. Mr. Hardman served as Chief Tax Officer from 1999 until he was appointed to his current position in 2002. Prior to joining Huntsman in 1999, Mr. Hardman was a tax Senior Manager with Deloitte & Touche, LLP where he worked for 10 years. Mr. Hardman is a CPA and holds a master's degree in tax accounting.
L. Russell Healy is Vice President, Finance of our Company, HIH, AdMat and Huntsman LLC. Mr. Healy also serves as an officer or director of several subsidiaries of our Company and Huntsman LLC. Previously, Mr. Healy served as Vice President, Finance and Vice President, Tax for our Company and Huntsman LLC. Prior to joining Huntsman in 1995, Mr. Healy was a partner with the accounting firm of Deloitte & Touche, LLP. Mr. Healy is a CPA and holds a master's degree in accounting.
67
John R. Heskett is Vice President, Corporate Development. Mr. Heskett has held this position since 2002. Mr. Heskett also serves as Vice President, Corporate Development for HIH, AdMat and Huntsman LLC and as Vice President of Huntsman Surfactants Technology Corporation. Mr. Heskett previously served as Assistant Treasurer for Huntsman LLC and its subsidiaries, Huntsman Petrochemical Corporation and Huntsman Polymers Corporation. Prior to joining Huntsman in 1997, Mr. Heskett was Assistant Vice President and Relationship Manager for PNC Bank, N.A., where he worked for several years.
Karen H. Huntsman is Vice President. Mrs. Huntsman has served in this position since 1999. Mrs. Huntsman performs an active role in all the Huntsman businesses and currently serves as an officer and/or board member for many of the Huntsman companies. Mrs. Huntsman has served as a member of the Utah State Board of Regents and on the board of directors of First Security Corporation. She also serves on the board of directors of various not-for-profit entities.
Richard H. Johnigan, Jr. is Vice President and Controller of our Company, HIH and Huntsman LLC. Mr. Johnigan has held this position since 2001. Prior to joining Huntsman in 1997, Mr. Johnigan was Vice President and Controller of Oxychem, where he worked for 23 years. Mr. Johnigan, a CPA, held several executive positions at Oxychem, including Vice President and Chief Financial Officer of the Polymers and Agricultural Chemicals Divisions.
James R. Moore is Vice President and Deputy General Counsel of our Company, HIH and Huntsman LLC. Mr. Moore served as Vice President and Chief Environmental Counsel from 2002 until he was appointed to his current position in 2003. Prior to joining Huntsman in 1998, Mr. Moore was a partner at the Seattle law firm of Perkins Coie and also served in various environmental counsel positions with the U.S. Department of Justice and Environmental Protection Agency.
Richard Michaelson is a Manager of HIH and Huntsman LLC and Chairman of the HIH and Huntsman LLC Audit Committees. Mr. Michaelson is the Chief Financial Officer and Secretary of Life Sciences Research Inc., a contract research organization providing global outsourcing services to the pharmaceutical industry. Prior to his joining Life Sciences Research Inc. in 1998, he was a partner in Focused Healthcare Partners, a healthcare investment company. Mr. Michaelson was the Chief Financial Officer of Unilab Corporation, California's largest provider of clinical laboratory services from 1993 to 1997, and held a succession of senior management positions at MetPath (now Quest Diagnostics) between 1982 and 1993. Mr. Michaelson was a financial analyst at IBM from 1979 to 1982.
Christopher Pechock is a Manager of HIH and Huntsman LLC and a member of the HIH and Huntsman LLC Audit Committees. Mr. Pechock has been active in the distressed securities markets for 14 years. Prior to July 2002, Mr. Pechock was a member of Credit Suisse First Boston's Distressed Group, which he joined in 1999. Before joining Credit Suisse First Boston, Mr. Pechock was a Portfolio Manager and Research Analyst in distressed securities at Turnberry Capital Management, L.P. from 1997 to 1999, a Portfolio Manager in distressed securities and special situations at Eos Partners, L.P. from 1996 to 1997, a Vice President and high yield analyst at PaineWebber Inc. from 1993 to 1996 and an analyst in risk arbitrage at Wertheim Schroder & Co., Incorporated from 1987 to 1991.
James A. Huffman is a Manager of HIH and Huntsman LLC and a member of the HIH and Huntsman LLC Audit Committees. Mr. Huffman serves or has served in a number of executive positions for Huntsman affiliated companies since 1998, including Vice President, Strategic Planning of our Company and Vice President of Huntsman Genomics Company. Prior to joining Huntsman, Mr. Huffman worked for the global management consulting firm of McKinsey & Company as an engagement manager. Mr. Huffman also worked for Huntsman in a variety of positions from 1991 to 1994, including Director, New Business Development and Manager, Credit for Huntsman Packaging Corporation, a former Huntsman subsidiary.
68
Audit Committee Financial Expert
Our Company has not separately established an Audit Committee, but the Audit Committee of our parent company, HIH, functions as the Audit Committee of our Company. The board of managers of our Company and HIH have determined that Richard Michaelson, who serves as the Chairman of the HIH Audit Committee, is an audit committee financial expert as defined by Item 401(h) of Regulation S-K under the Securities Exchange Act of 1934, as amended and that Richard Michaelson is independent as defined under the standards adopted by the New York Stock Exchange.
Identification of the Audit Committee
As noted, our Company has not separately established an Audit Committee, but the Audit Committee of our parent company, HIH, functions as the Audit Committee of our Company. We believe our separately-designated standing Audit Committee has been established in accordance with Section 3(a)(58)(A) of the Exchange Act. The members of the Audit Committee are Richard Michaelson, James A. Huffman and Christopher Pechock.
We have adopted a code of ethics, as defined by Item 406(b) of Regulation S-K under the Exchange Act, that applies to our principal executive officer, principal financial officer and principal accounting officer or controller. A copy of the code of ethics is filed as an exhibit to this report and posted on our website, at www.huntsman.com. We intend to disclose any amendments to, or waivers from, our code of ethics on our website, www.huntsman.com.
69
ITEM 11. EXECUTIVE COMPENSATION
Summary of Compensation
The following summary compensation table sets forth information concerning compensation earned in the fiscal year ended December 31, 2003, by our chief executive officer and our remaining four most highly compensated executive officers at the end of the last fiscal year. Information is also included for the former president of Pigments who would have been among the most highly compensated executive officers if he had not ceased to be an executive officer during the year.
All of the compensation of Messrs. Peter R. Huntsman, J. Kimo Esplin, Thomas J. Keenan and Samuel D. Scruggs was paid entirely by Huntsman LLC, our affiliate. Compensation figures for these executive officers set forth below represent total amounts paid for services rendered to Huntsman LLC and all of its affiliates including our Company. Only a portion of that compensation is attributable to services rendered to our Company and our subsidiaries for which we were charged a management overhead allocation. All of the compensation of Messrs. Thomas and Coombs was paid entirely by our Company.
| |
|
|
|
|
Long-Term Compensation Awards |
|
|||||||||||
|---|---|---|---|---|---|---|---|---|---|---|---|---|---|---|---|---|---|
| |
|
Annual Compensation(1) |
Number of Securities Underlying Options/EARs Granted(21) |
|
|||||||||||||
| Name and Principal Position |
Year |
Salary |
Bonus |
Other Annual Compensation(2) |
All Other Compensation |
||||||||||||
| Peter R. Huntsman President, Chief Executive Officer and Manager |
2003 2002 2001 |
$ $ $ |
1,348,749 1,144,000 1,129,700 |
$ $ $ |
750,000 500,000 |
(3) |
$ $ $ |
1,538,136 452,434 678,170 |
(4) (6) (7) |
0 0 263,158 |
$ $ $ |
172,340 135,520 1,668,046 |
(5) (5) (5) |
||||
| J. Kimo Esplin Executive Vice President and Chief Financial Officer |
2003 2002 2001 |
$ $ $ |
410,775 397,318 386,250 |
$ $ $ |
400,000 250,000 |
(3) |
$ $ $ |
381,674 |
(9) |
0 0 92,106 |
$ $ $ |
49,336 23,464 92,422 |
(8) (8) (8) |
||||
| Patrick W. Thomas(22) Former President—Polyurethanes |
2003 2002 2001 |
$ $ $ |
554,792 484,544 381,323 |
$ $ $ |
452,136 385,998 |
(3) |
$ $ $ |
168,476 143,329 123,699 |
(10) (11) (12) |
0 0 0 |
$ $ $ |
0 0 125,000 |
(13) |
||||
| Thomas J. Keenan President—Pigments |
2003 2002 2001 |
$ $ $ |
317,466 287,100 278,100 |
$ $ $ |
119,395 482,892 280,800 |
$ $ $ |
123,317 |
(14) |
0 13,158 |
$ $ $ |
80,036 49,432 91,397 |
(15) (15) (15) |
|||||
| Samuel D. Scruggs Executive Vice President and General Counsel |
2003 2002 2001 |
$ $ $ |
342,448 332,350 262,308 |
$ $ $ |
400,000 300,000 |
(3) |
$ $ $ |
0 0 19,737 |
$ $ $ |
37,122 22,970 88,873 |
(16) (16) (16) |
||||||
| Douglas Coombs(17) Former President—Pigments |
2003 2002 2001 |
$ $ $ |
333,617 284,928 243,163 |
$ $ $ |
843,270 1,081,227 658,565 |
$ $ $ |
375,620 384,077 354,782 |
(18) (19) (20) |
0 0 0 |
$ $ $ |
0 0 0 |
||||||
70
71
Equity Options and Equity Appreciation Rights
There were no grants of equity options or equity appreciation rights ("EARs") during the last fiscal year.
Exercise of Options and Equity Appreciation Rights
The following table sets forth information concerning the exercise of EARs during the last fiscal year by each of the Company's chief executive officer and its other most highly compensated executive officers listed in the summary compensation table, above, and the fiscal year-end value of unexercised EARs. The EARs represent a right to a cash payment upon exercise equal to the difference between the value (determined by a formula) of a share of Huntsman Corporation stock (prior to the Restructuring) at exercise and the dollar amount per share set forth in the EAR at grant, multiplied by the number of shares represented by the EAR. There is no right under the EARs to receive any form of stock or equity interest in the Company or any other entity. The Company is reviewing possible alternative incentive compensation programs and may allow selected participants to exchange EARs for rights in an alternative program.
AGGREGATED OPTION/EAR EXERCISES IN LAST FISCAL YEAR, AND FY-END OPTION/EAR VALUES
| |
|
|
Number of Securities Underlying Unexercised Options/EARs at FY-End (#) |
|
|
||||||||||
|---|---|---|---|---|---|---|---|---|---|---|---|---|---|---|---|
| |
|
|
Value of Unexercised In-the-Money Options/EARs at FY-End |
||||||||||||
| |
Securities Acquired on Exercise (#) |
|
|||||||||||||
| Name |
Value Realized |
||||||||||||||
| Exercisable |
Unexercisable |
Exercisable |
Unexercisable |
||||||||||||
| Peter R. Huntsman | 0 | $ | 0 | 131,579 | 131,579 | $ | 0 | $ | 0 | ||||||
| J. Kimo Esplin | 0 | $ | 0 | 46,053 | 46,053 | $ | 0 | $ | 0 | ||||||
| Patrick W. Thomas | 0 | $ | 0 | 5,540 | 1,846 | $ | 0 | $ | 0 | ||||||
| Thomas J. Keenan | 0 | $ | 0 | 6,579 | 6,579 | $ | 0 | $ | 0 | ||||||
| Samuel D. Scruggs | 0 | $ | 0 | 9,869 | 9,868 | $ | 0 | $ | 0 | ||||||
| Douglas Coombs | 0 | $ | 0 | 0 | 0 | $ | 0 | $ | 0 | ||||||
Retirement Plans
The following table shows the estimated annual benefits payable under Huntsman LLC's tax-qualified defined benefit pension plan (the "Huntsman Pension Plan") and supplemental pension plan ("Huntsman SERP") in specified final average earnings and years-of-service classification.
72
| |
Years of Benefit Service at Retirement |
||||||||||||||||||||||||
|---|---|---|---|---|---|---|---|---|---|---|---|---|---|---|---|---|---|---|---|---|---|---|---|---|---|
| Final Average Compensation |
|||||||||||||||||||||||||
| 5 |
10 |
15 |
20 |
25 |
30 |
35 |
40 |
||||||||||||||||||
| $ | 250,000 | $ | 18,800 | $ | 37,500 | $ | 56,300 | $ | 75,000 | $ | 93,800 | $ | 112,500 | $ | 131,300 | $ | 150,000 | ||||||||
| 300,000 | 22,500 | 45,000 | 67,500 | 90,000 | 112,500 | 135,000 | 157,500 | 180,000 | |||||||||||||||||
| 350,000 | 26,300 | 52,500 | 78,800 | 105,000 | 131,300 | 157,500 | 183,800 | 210,000 | |||||||||||||||||
| 400,000 | 30,000 | 60,000 | 90,000 | 120,000 | 150,000 | 180,000 | 210,000 | 240,000 | |||||||||||||||||
| 450,000 | 33,800 | 67,500 | 101,300 | 135,000 | 168,800 | 202,500 | 236,300 | 270,000 | |||||||||||||||||
| 500,000 | 37,500 | 75,000 | 112,500 | 150,000 | 187,500 | 225,000 | 262,500 | 300,000 | |||||||||||||||||
| 600,000 | 45,000 | 90,000 | 135,000 | 180,000 | 225,000 | 270,000 | 315,000 | 360,000 | |||||||||||||||||
| 700,000 | 52,500 | 105,000 | 157,500 | 210,000 | 262,500 | 315,000 | 367,500 | 420,000 | |||||||||||||||||
| 800,000 | 60,000 | 120,000 | 180,000 | 240,000 | 300,000 | 360,000 | 420,000 | 480,000 | |||||||||||||||||
| 900,000 | 67,500 | 135,000 | 202,500 | 270,000 | 337,500 | 405,000 | 472,500 | 540,000 | |||||||||||||||||
| 1,000,000 | 75,000 | 150,000 | 225,000 | 300,000 | 375,000 | 450,000 | 525,000 | 600,000 | |||||||||||||||||
| 1,250,000 | 93,800 | 187,500 | 281,300 | 375,000 | 468,800 | 562,500 | 656,300 | 750,000 | |||||||||||||||||
| 1,500,000 | 112,500 | 225,000 | 337,500 | 450,000 | 562,500 | 675,000 | 787,500 | 900,000 | |||||||||||||||||
| 1,750,000 | 131,300 | 262,500 | 393,800 | 525,000 | 656,300 | 787,500 | 918,800 | 1,050,000 | |||||||||||||||||
The current Huntsman Pension Plan benefit is based on the following formula: 1.5% of final average compensation multiplied by years of credited service, minus 1.5% of estimated Social Security benefits multiplied by years of credited service (maximum of 50% of Social Security benefits). For years of credited service prior to 2000, benefits are based on a 1.4% formula. Final average compensation is based on the highest average of three consecutive years of compensation. Messrs. Peter R. Huntsman, J. Kimo Esplin, Thomas J. Keenan and Samuel D. Scruggs were participants in the Huntsman Pension Plan in 2003. For the foregoing named executive officers, covered compensation under this plan consists of base salary and is reflected in the "Salary" column of the Summary Compensation Table. Federal regulations require that for the 2003 plan year, no more than $200,000 in compensation be considered for the calculation of retirement benefits under the Huntsman Pension Plan, and the maximum annual benefit paid from a qualified defined benefit plan cannot exceed $160,000. Benefits are calculated on a straight life annuity basis. The benefit amounts under the Huntsman Pension Plan shown in the above table do not reflect the offset for Social Security that is part of the formula set forth above.
The Huntsman SERP is a nonqualified supplemental pension plan for designated executive officers that provides benefits based on certain compensation amounts not included in the calculation of benefits payable under the Huntsman Pension Plan.(1) Messrs. Peter R. Huntsman, J. Kimo Esplin, Thomas J. Keenan and Samuel D. Scruggs were participants in the Huntsman SERP in 2003. The compensation amounts taken into account for these named executive officers under the Huntsman SERP include bonuses (as reflected in the "Bonus" columns of the Summary Compensation Table) and base salary in excess of the qualified plan limitations. The Huntsman SERP benefit related to the Huntsman Pension Plan is calculated as the difference between (1) the benefit determined using the Huntsman Pension Plan formula with unlimited base salary plus bonus, and (2) the benefit determined using base salary as limited by federal regulations.
73
executives mentioned above is included in the Summary Compensation Table under the "All Other Compensation" column.
The number of completed years of credited service as of December 31, 2003 under the Huntsman Pension Plan and Huntsman SERP for Messrs. Peter R. Huntsman, J. Kimo Esplin, and Samuel D. Scruggs, were 20, 9 and 8 years, respectively. For Mr. Thomas J. Keenan, the number of completed years of credited service as of December 31, 2003 under the Huntsman Pension Plan and the Huntsman SERP were 9 and 19 years, respectively.
Mr. Thomas participates in the Huntsman Pension Fund VZW in Belgium (the "Huntsman Belgium Pension Fund"). The following table shows the estimated lump sum retirement benefit payable under the Huntsman Belgium Pension Fund in specified final pensionable earnings and years-of-benefit service classification.
74
HUNTSMAN BELGIUM PENSION FUND TABLE—(LUMP SUM BENEFIT)
($ in thousands)
| |
Years of Benefit Service at Retirement |
||||||||||||||||||||||||
|---|---|---|---|---|---|---|---|---|---|---|---|---|---|---|---|---|---|---|---|---|---|---|---|---|---|
| Final Pensionable Compensation |
|||||||||||||||||||||||||
| 5 |
10 |
15 |
20 |
25 |
30 |
35 |
40 |
||||||||||||||||||
| $ | 250 | $ | 228 | $ | 455 | $ | 683 | $ | 911 | $ | 1,138 | $ | 1,366 | $ | 1,593 | $ | 1,821 | ||||||||
| $ | 300 | $ | 273 | $ | 546 | $ | 819 | $ | 1,093 | $ | 1,366 | $ | 1,639 | $ | 1,912 | $ | 2,186 | ||||||||
| $ | 350 | $ | 319 | $ | 637 | $ | 956 | $ | 1,275 | $ | 1,593 | $ | 1,912 | $ | 2,231 | $ | 2,549 | ||||||||
| $ | 400 | $ | 364 | $ | 728 | $ | 1,093 | $ | 1,457 | $ | 1,821 | $ | 2,186 | $ | 2,549 | $ | 2,914 | ||||||||
| $ | 450 | $ | 410 | $ | 819 | $ | 1,229 | $ | 1,639 | $ | 2,049 | $ | 2,458 | $ | 2,868 | $ | 3,278 | ||||||||
| $ | 500 | $ | 455 | $ | 911 | $ | 1,366 | $ | 1,821 | $ | 2,276 | $ | 2,732 | $ | 3,187 | $ | 3,642 | ||||||||
| $ | 550 | $ | 501 | $ | 1,002 | $ | 1,502 | $ | 2,003 | $ | 2,504 | $ | 3,005 | $ | 3,505 | $ | 4,006 | ||||||||
| $ | 600 | $ | 546 | $ | 1,093 | $ | 1,639 | $ | 2,186 | $ | 2,732 | $ | 3,278 | $ | 3,824 | $ | 4,370 | ||||||||
| $ | 650 | $ | 592 | $ | 1,184 | $ | 1,775 | $ | 2,367 | $ | 2,959 | $ | 3,551 | $ | 4,143 | $ | 4,735 | ||||||||
| $ | 700 | $ | 637 | $ | 1,275 | $ | 1,912 | $ | 2,549 | $ | 3,187 | $ | 3,824 | $ | 4,461 | $ | 5,099 | ||||||||
| $ | 750 | $ | 683 | $ | 1,366 | $ | 2,049 | $ | 2,732 | $ | 3,414 | $ | 4,097 | $ | 4,780 | $ | 5,463 | ||||||||
The Huntsman Belgium Pension Fund formula provides a lump sum benefit equal to 8.57% of final pensionable compensation up to the Belgian Social Security earnings ceiling, plus 18.21% of pensionable compensation above the ceiling, times years of service. Final pensionable compensation is the base salary for the final year of employment. Covered compensation for Mr. Thomas under the plan is reflected in the "Salary" column of the Summary Compensation Table. As of December 31, 2003, Mr. Thomas had 14.5 years of service in Belgium. The benefit amounts for the Huntsman Belgium Pension Fund shown in the table do not reflect the integration with Belgian Social Security that is part of the formula set forth above.
Mr. Thomas also participates in the International Pension Plan (the "IPP") which is a nonregistered plan designed to protect the pension benefits of employees whose service involves participation in pension plans in more than one country. In addition to his service in Belgium, Mr. Thomas also has 9.83 years of service in the UK which is covered under the ICI UK Pension Scheme. Through the IPP, Mr. Thomas at retirement can elect to receive a total pension benefit (which includes his retirement benefits being provided by the Huntsman Belgium Pension Fund and the ICI UK Pension Scheme) that is the greater of: (1) the benefit under the ICI UK Pension Scheme (with slight modifications if Mr. Thomas has less than 10 years of actual UK service) based upon his combined service in Belgium and the UK, or (2) the benefit under the Huntsman Belgium Pension Fund based upon his combined service in Belgium and the UK.
The ICI UK Pension Scheme formula is 2.2% of final pensionable compensation up to $20,072 (£11,250), plus 1.83% of final pensionable compensation above $20,072 (£11,250), minus 1/50th of the current State pension benefit, times actual years of service; subject to a maximum limit of 2/3rd of final pensionable compensation times actual years of service, divided by total possible service to retirement. Mr. Thomas has 9.83 years of service under the ICI UK Pension Scheme. Currently, the benefit under the IPP using the Huntsman Belgium Pension Fund for his 24.33 years of total service is the most beneficial.
Mr. Douglas A.L. Coombs has a pension promise in respect of service on and after September 1, 1999 that guarantees him a pension as if he were employed in Canada. The formula for this plan is based on the formula for the Pension Plan of ICI Canada Inc. for Senior Managers (the "Canadian Pension Plan"). The following table shows the estimated annual benefits payable under the Canadian Pension Plan in specified final average compensation and years-of-benefit service classification.
75
| |
Years of Benefit Service at Retirement |
||||||||||||||||||||||||
|---|---|---|---|---|---|---|---|---|---|---|---|---|---|---|---|---|---|---|---|---|---|---|---|---|---|
| Final Average Compensation |
|||||||||||||||||||||||||
| 5 |
10 |
15 |
20 |
25 |
30 |
35 |
40 |
||||||||||||||||||
| $ | 250,000 | $ | 25,300 | $ | 50,600 | $ | 76,000 | $ | 101,300 | $ | 126,600 | $ | 151,900 | $ | 177,300 | $ | 202,600 | ||||||||
| $ | 275,000 | $ | 27,900 | $ | 55,900 | $ | 83,800 | $ | 111,800 | $ | 139,700 | $ | 167,700 | $ | 195,600 | $ | 223,600 | ||||||||
| $ | 300,000 | $ | 30,600 | $ | 61,100 | $ | 91,700 | $ | 122,300 | $ | 152,900 | $ | 183,400 | $ | 214,000 | $ | 244,600 | ||||||||
| $ | 325,000 | $ | 33,200 | $ | 66,400 | $ | 99,600 | $ | 132,800 | $ | 166,000 | $ | 199,200 | $ | 232,400 | $ | 265,600 | ||||||||
| $ | 350,000 | $ | 35,800 | $ | 71,600 | $ | 107,500 | $ | 143,300 | $ | 179,100 | $ | 214,900 | $ | 250,800 | $ | 286,600 | ||||||||
| $ | 375,000 | $ | 38,400 | $ | 76,900 | $ | 115,300 | $ | 153,800 | $ | 192,200 | $ | 230,700 | $ | 269,100 | $ | 307,600 | ||||||||
| $ | 400,000 | $ | 41,100 | $ | 82,100 | $ | 123,200 | $ | 164,300 | $ | 205,400 | $ | 246,400 | $ | 287,500 | $ | 328,600 | ||||||||
| $ | 450,000 | $ | 46,300 | $ | 92,600 | $ | 139,000 | $ | 185,300 | $ | 231,600 | $ | 277,900 | $ | 324,300 | $ | 370,600 | ||||||||
| $ | 500,000 | $ | 51,600 | $ | 103,100 | $ | 154,700 | $ | 206,300 | $ | 257,900 | $ | 309,400 | $ | 361,000 | $ | 412,600 | ||||||||
| $ | 550,000 | $ | 56,800 | $ | 113,600 | $ | 170,500 | $ | 227,300 | $ | 284,100 | $ | 340,900 | $ | 397,800 | $ | 454,600 | ||||||||
| $ | 600,000 | $ | 62,100 | $ | 124,100 | $ | 186,200 | $ | 248,300 | $ | 310,400 | $ | 372,400 | $ | 434,500 | $ | 496,600 | ||||||||
| $ | 650,000 | $ | 67,300 | $ | 134,600 | $ | 202,000 | $ | 269,300 | $ | 336,600 | $ | 403,900 | $ | 471,300 | $ | 538,600 | ||||||||
| $ | 700,000 | $ | 72,600 | $ | 145,100 | $ | 217,700 | $ | 290,300 | $ | 362,900 | $ | 435,400 | $ | 508,000 | $ | 580,600 | ||||||||
| $ | 750,000 | $ | 77,800 | $ | 155,600 | $ | 233,500 | $ | 311,300 | $ | 389,100 | $ | 466,900 | $ | 544,800 | $ | 622,600 | ||||||||
| $ | 800,000 | $ | 83,100 | $ | 166,100 | $ | 249,200 | $ | 332,300 | $ | 415,400 | $ | 498,400 | $ | 581,500 | $ | 664,600 | ||||||||
| $ | 850,000 | $ | 88,300 | $ | 176,600 | $ | 265,000 | $ | 353,300 | $ | 441,600 | $ | 529,900 | $ | 618,300 | $ | 706,600 | ||||||||
| $ | 900,000 | $ | 93,600 | $ | 187,100 | $ | 280,700 | $ | 374,300 | $ | 467,900 | $ | 561,400 | $ | 655,000 | $ | 748,600 | ||||||||
| $ | 950,000 | $ | 98,800 | $ | 197,600 | $ | 296,500 | $ | 395,300 | $ | 494,100 | $ | 592,900 | $ | 691,800 | $ | 790,600 | ||||||||
| $ | 1,000,000 | $ | 104,100 | $ | 208,100 | $ | 312,200 | $ | 416,300 | $ | 520,400 | $ | 624,400 | $ | 728,500 | $ | 832,600 | ||||||||
For each year of benefit service the Canadian Pension Plan provides an annual pension at retirement equal to 1.5% of final average compensation up to the maximum pensionable earnings ceiling in Canada ("YMPE"), plus 2.1% of the final average compensation above YMPE. The pension payable at retirement is a lifetime pension, with 60% of that pension continuing to the surviving spouse upon the death of Mr. Coombs. In 2003, YMPE is $30,875 (C$39,900). Final average compensation is defined as the final average earnings over the final three-year period of employment. For Mr. Coombs, covered compensation under this plan formula consists of notional salary. Notional salary is the amount reflected in the "Salary" column of the Summary Compensation Table together with a tax gross-up which is included in the amount reflected in the "Other Annual Compensation" column of the Summary Compensation Table. For 2003, the notional salary of Mr. Coombs for purposes of the plan was $494,361. As of December 31, 2003, Mr. Coombs has completed 4.33 years of benefit service under this plan formula.
Compensation of Managers
The managers do not receive any additional compensation for their service as managers.
76
ITEM 12. SECURITY OWNERSHIP OF CERTAIN BENEFICIAL OWNERS AND MANAGEMENT AND RELATED STOCKHOLDER MATTERS
Our Company is 100% owned by HIH. HIH is 100% owned, directly and indirectly, by HMP. HMP is 100% owned by HGI, subject to warrants which, if exercised, would result in the holders thereof owning up to 12% of the common stock of HMP. HGI is 100% owned by Huntsman Holdings. The ownership of Huntsman Holdings is set forth in the following table:
EQUITY SECURITIES OF HUNTSMAN HOLDINGS
| Units |
Owner |
Percent of Class |
Number of Units |
|||
|---|---|---|---|---|---|---|
| Class A Common (voting) |
GOP Individual Investors (including members of the Huntsman family and our senior management) |
95.7 0.7 |
% % |
9,567,991 69,585 |
||
| CPH | 3.6 | % | 362,424 | |||
Class B Common (voting) |
Huntsman Family Holdings Company LLC |
100 |
% |
10,000,000 |
||
Preferred (non-voting) |
Huntsman Holdings Preferred Member, LLC(1) |
100 |
% |
Undivided interest |
||
Tracking Preferred(2) Series A (non-voting) |
GOP CPH |
98.1 1.9 |
% % |
Issued as a percentage of the series |
||
Tracking Preferred(2) Series B (non-voting) |
Huntsman Family Holdings Company LLC CPH |
97.0 3.0 |
% % |
Issued as a percentage of the series |
||
Tracking Preferred(2) Series C (non-voting) |
GOP CPH |
98.1 1.9 |
% % |
Issued as a percentage of the series |
||
Tracking Preferred(2) Series D (non-voting) |
Huntsman Family Holdings Company LLC CPH |
97.0 3.0 |
% % |
Issued as a percentage of the series |
Beneficial Ownership by Jon M. Huntsman
Jon M. Huntsman has the ability to designate a majority of the members of the board of managers of our Company, subject to certain rights held by GOP. See "—Rights Held by GOP" below. Jon M. Huntsman owns a controlling interest in Huntsman Family Holdings Company LLC ("Family Holdings") and Family Holdings owns 100% of the Class B Common Units of Huntsman Holdings. The Huntsman Holdings limited liability company agreement (the "Huntsman Holdings LLC Agreement") provides that the holder of its Class B Common Units has the right to designate a majority of the directors or managers, as applicable, of HGI, HMP, and Huntsman LLC. The Huntsman Holdings LLC
77
Agreement also provides that, except for certain rights held by GOP described below, the voting power and other rights of the equity holders of HGI, HMP and Huntsman LLC will be exercised as directed by Family Holdings (as the holder of the Huntsman Holdings Class B Units). HMP owns 100% of HIH (directly and indirectly), and has the ability to designate its managers, except for certain rights held by GOP described below. HIH owns 100% of our Company, and has the right to designate our managers. Because Jon M. Huntsman owns a majority of the equity of Family Holdings, he controls the following (subject to certain rights held by GOP described below):
Rights Held by GOP
GOP has certain important rights pursuant to the Huntsman Holdings LLC Agreement relating to the designation of directors and managers, approval rights with respect to the taking of certain actions, and the initiation of certain sales of all or substantially all the assets or equity of HGI, HMP or Huntsman LLC. GOP has the right to designate some, but less than a majority, of the directors or managers, as applicable, of HGI, HMP and Huntsman LLC. GOP has the right to designate one manager of HIH pursuant to an Interest Holders Agreement among Huntsman Holdings, HGI, HMP, Huntsman LLC, Family Holdings and GOP (the "Interest Holders Agreement"). GOP also has the right to designate our Company as a "Key Subsidiary" under the Interest Holders Agreement if GOP reasonably determines that we operate businesses that are significant to the overall business of HMP and its subsidiaries, taken as a whole. Designation of our Company as a Key Subsidiary would entitle GOP to designate one manager on our board. In general, the following actions may not be taken by HGI, HMP, Huntsman LLC, HIH, or our Company without the approval of at least one of the directors or managers designated by GOP:
78
In general, the following actions may not be taken by HGI, HMP, Huntsman LLC, HIH or our Company without the approval of GOP:
GOP also has certain rights, after September 30, 2007, to initiate the sale of all or substantially all of the equity or assets of HGI, HMP or Huntsman LLC. The organizational documents of HGI, HMP and Huntsman LLC require the directors or managers, as applicable, to take certain actions in order to facilitate any such process (and the Interest Holders Agreement requires HIH to facilitate any such process). If the directors or managers fail to take those actions, GOP would acquire the right to designate a majority of the directors or managers, as applicable, of HGI, HMP and Huntsman LLC, the result of which would be the acquisition by GOP of the ability to designate all of the managers of HIH and our Company.
Security Ownership of Certain Beneficial Owners
The following table lists each person who is known to the registrant to be the beneficial owner of more than five percent of any class of the registrant's voting securities:
EQUITY SECURITIES OF HUNTSMAN INTERNATIONAL LLC
| Title of Class |
Name and Address of Beneficial Owner |
Amount and Nature of Beneficial Ownership |
Percent of Class |
||||
|---|---|---|---|---|---|---|---|
| Membership Interests | Jon M. Huntsman(1) 500 Huntsman Way Salt Lake City, Utah 84108 |
1,000 | 100 | % | |||
Membership Interests |
Karen H. Huntsman(2) 500 Huntsman Way Salt Lake City, Utah 84108 |
1,000 |
100 |
% |
Security Ownership of Management
The table below sets forth information concerning the ownership of equity securities in Huntsman Holdings, our ultimate parent, by each of the members of our board of managers, our chief executive officer and our remaining four most highly compensated executive officers, and the members of our board of managers and our executive officers as a group.
79
EQUITY SECURITIES OF HUNTSMAN HOLDINGS
| Name and Address of Beneficial Owner |
Title of Class |
Amount and Nature of Beneficial Ownership |
Percent of Class |
||||
|---|---|---|---|---|---|---|---|
| Jon M. Huntsman | Class B Common | 10,000,000(1) | 100.0 | % | |||
| Tracking Preferred Series B(2) | Issued as a percentage of the Series | 97.0 | % | ||||
| Tracking Preferred Series D(2) | Issued as a percentage of the Series | 97.0 | % | ||||
Peter R. Huntsman |
Class A Common |
28,993 |
0.3 |
% |
|||
| Class B Common | 409,020(3) | 0.4 | % | ||||
| Preferred | Percentage of interest | 0.3 | %(4) | ||||
| Tracking Preferred Series B(5) | Issued as a percentage of the Series | 17.9 | % | ||||
| Tracking Preferred Series D(5) | Issued as a percentage of the Series | 17.9 | % | ||||
J. Kimo Esplin |
Class A Common |
14,497 |
0.1 |
% |
|||
| Preferred | Percentage of interest | 0.1 | %(4) | ||||
Samuel D. Scruggs |
Class A Common |
14,497 |
0.1 |
% |
|||
| Preferred | Percentage of interest | 0.1 | %(4) | ||||
Patrick W. Thomas |
None |
— |
— |
||||
Douglas A.L. Coombs |
None |
— |
— |
||||
Thomas J. Keenan |
None |
— |
— |
||||
Members of our board of managers and our executive officers as a group |
Class A Common Class B Common(6) Preferred(7) Tracking Preferred Series B(8) Tracking Preferred Series D(8) |
69,585 10,000,000 Percentage of interest Percent of Series Percent of Series |
0.7 100.0 0.7 97.0 97.0 |
% % % % % |
80
Huntsman LLC has certain term and revolving credit facilities (the "HLLC Credit Facilities"), and has also issued certain senior secured notes (the "HLLC Secured Notes") that are secured, in part, by a pledge of 60% of the equity of HIH. The sale of those pledged interests, whether as a result of a foreclosure under the HLLC Credit Facilities or the HLLC Secured Notes or in connection with a bankruptcy or similar proceedings or otherwise, could result in a change in control of our Company.
HMP issued certain senior discount notes (the "HMP Senior Discount Notes") in connection with the HIH Consolidation Transaction. The HMP Senior Discount Notes are secured by, among other things, a pledge of 40% of the equity interests of HIH, as well as all the equity interests of Huntsman LLC and HMP. In the event of a default under the HMP Senior Discount Notes, the trustee under the indenture governing the HMP Senior Discount Notes could foreclose on the collateral, including those equity interests. Sale of those equity interests, whether as a result of foreclosure or in connection with bankruptcy or similar proceedings or otherwise, could result in a change in control of our Company.
GOP has certain rights under the Huntsman Holdings LLC Agreement, after September 30, 2007, to initiate the sale of all or substantially all of the equity or assets of HGI, HMP or Huntsman LLC. The organizational documents of HGI, HMP, and Huntsman LLC require the directors or managers, as applicable, to take certain actions in order to facilitate any such process. If the directors or managers of HGI, HMP or Huntsman LLC fail to take those actions, GOP will acquire the right to designate a majority of such directors or managers which could result in a change in control of our Company, as could the consummation of any sale contemplated by the foregoing process or otherwise.
Equity Compensation Plan Information
The Company does not have any compensation plans under which equity securities of the Company are authorized for issuance.
81
ITEM 13. CERTAIN RELATIONSHIPS AND RELATED TRANSACTIONS
Huntsman LLC Agreements
We share numerous services and resources with Huntsman LLC. We also rely on Huntsman LLC to supply some of our raw materials and to purchase a significant portion of our products. During the year ended December 31, 2003, purchases from and sales to Huntsman LLC and its subsidiaries were $200.9 million and $72.4 million, respectively.
We have entered into an agreement with Huntsman LLC under which Huntsman LLC provides us with administrative support and a range of services, including treasury and risk management, human resources, technical and legal services for our businesses in the U.S. and elsewhere. In 2003, we paid $28.5 million for these services. We also participate in Huntsman LLC's worldwide insurance program. Furthermore, we provide a limited range of services to Huntsman LLC's businesses in Europe and elsewhere. These agreements provide for fees based on an equitable allocation of the general and administrative costs and expenses. We believe that these transactions have been made on terms which are no less favorable to us than would be expected from an unaffiliated third- party. See "Item 7—Management's Discussion and Analysis of Financial Condition and Results of Operations—Cautionary Statement for Forward-Looking Information—If we are unable to maintain our relationships with Huntsman LLC, then we may not be able to replace on favorable terms our contracts with them or the services and facilities that they provide, if at all."
Tax Sharing Arrangement
Pursuant to our limited liability company agreement and the limited liability company agreement of HIH, we have a tax sharing arrangement with all of our and HIH's membership interest holders. Under the arrangement, because we are treated as a partnership for United States income tax purposes, we will make payments to our parent, HIH, which will in turn make payments to its membership interest holders, in an amount equal to the United States federal and state income taxes we and HIH would have paid had HIH been treated as a corporation for tax purposes. The arrangement also provides that, if we had previously made payments to HIH, and HIH had made payments out to its membership interest holders, we will receive cash payments back from the membership interest holders (through HIH) in amounts equal to the United States federal and state income tax refunds or benefit against future tax liabilities we would have received from the use of net operating losses or tax credits generated by us, up to the amount of payments that we had previously made. As of December 31, 2003, approximately $ 3.9 million is due to us from the membership interest holders (through HIH).
Completion of the Vantico Restructuring and Acquisition
Vantico Group S.A. (collectively with its subsidiaries, "Vantico") was a Luxembourg corporation that was created through the 2000 buyout by Vantico's management and a private equity investor of the performance polymers division of Ciba Specialty Chemicals Holding Inc. On June 30, 2003, HMP and Huntsman Holdings completed a restructuring and acquisition involving Vantico. In conjunction with the acquisition, our affiliates formed AdMat and certain other entities to hold the Vantico business. AdMat is a leading global producer and marketer of technologically advanced specialty chemicals used in a wide variety of industrial and consumer applications. AdMat provides its customers with formulated polymer systems based on epoxy, polyurethane, acrylic and other materials; complex chemicals and additives; and basic and advanced epoxy resin compounds. AdMat's advanced materials products are used to address customer-specific application needs and are used in a wide variety of applications, such as adhesives, coating systems, electrical insulating materials, printed wiring boards, tooling and modeling materials and structural composites.
82
We do not own any AdMat securities, and there are no cross-company guarantees between us and AdMat. In addition, we will not be required to make any cash contributions to AdMat. We have entered into contractual arrangements with AdMat regarding management, technology and commercial matters, and certain of our current employees have assumed senior positions at AdMat. We believe that these transactions have been made on terms which are no less favorable to us than would be expected from an unaffiliated third-party.
Prior to this transaction, Vantico filed reports as a foreign private issuer under the Exchange Act. We have not verified, and disclaim any responsibility for, the accuracy or completeness of the information contained in such reports.
Consulting Agreement with Jon M. Huntsman
During 2003, we entered into an agreement with Jon M. Huntsman, pursuant to which Mr. Huntsman will be providing consulting services to us on an ongoing basis. Mr. Huntsman, who is not our employee, will provide advice and other business consulting services at our request regarding our products, our customers, our commercial and development strategies, our financial affairs, and our administrative matters based upon his experience and knowledge of our business, our industry, and the markets within which we compete. Mr. Huntsman's services will likely be utilized both with respect to the conduct of our business in the ordinary course, and with respect to strategic development and specific projects. Mr. Huntsman will receive $950,000 annually in exchange for his services. Mr. Huntsman is the Chairman of the Board of Managers of our Company.
Integration with Huntsman LLC's Polyols Businesses
Huntsman LLC produces certain polyols. Polyols are reacted with isocyanates, primarily MDI and TDI, to produce finished polyurethane products. We manage certain aspects of Huntsman LLC's polyols businesses. We purchase from Huntsman LLC and resell polyols produced by Huntsman LLC to be sold outside the Americas. We have also entered into certain related technology licensing arrangements with Huntsman LLC. We believe that these transactions have been made on terms which are no less favorable to us than would be expected from an unaffiliated third-party.
Supply Contracts
We are interdependent with Huntsman LLC with respect to the supply of certain feedstock, utilities and products. Under a supply agreement that expires in 2012, we are required to sell, and Huntsman LLC is required to purchase, a portion of the steam that we purchase from outside parties. Huntsman LLC reimburses us for the cost of the steam that it purchases from us. Under separate supply agreements, we have agreed to purchase our requirements of mono-ethylene glycol and tri-ethylene glycol from Huntsman LLC at market prices for use in our PO operations. Furthermore, in exchange for Huntsman LLC's PG tolling services, we pay Huntsman LLC a reservation fee, adjusted annually for inflation, plus a variable toll fee equal to Huntsman LLC's cost of operating the PG plant. In 2003, we paid Huntsman LLC approximately $6.1 million in fees under these contracts and received approximately $12 million in reimbursements from Huntsman LLC. We believe that these transactions have been made on terms which are no less favorable to us than would be expected from an unaffiliated third-party.
PO Supply Agreement
Pursuant to an existing agreement with Huntsman LLC that expires in 2012, we are obligated to sell, and Huntsman LLC is obligated to buy, all PO produced at our PO facility in Port Neches, Texas which is not purchased by our other customers. We are entitled to receive market prices for the PO
83
purchased by Huntsman LLC. During 2003, although Huntsman LLC was not required to purchase any PO from us under this agreement, it did purchase approximately $30 million of PO from us for use in its operations. We believe that these transactions have been made on terms which are no less favorable to us than would be expected from an unaffiliated third-party.
Propylene Supply Agreement
Pursuant to an agreement that expires in 2012, Huntsman LLC is obligated to provide 100% of the propylene required by us for operation of our PO facility, up to a maximum of 350 million pounds per year. We pay market prices for the propylene supplied by Huntsman LLC. In 2003, we spent approximately $53 million under this agreement. We believe that these transactions have been made on terms which are no less favorable to us than would be expected from an unaffiliated third-party.
Services Contracts
In order to operate our PO business, we have entered into a series of contracts with Huntsman LLC that expire in 2012 under which Huntsman LLC operates and maintains the PO facility, including the provision of management, personnel, transportation, information systems, accounting, tax and legal services, and research and development. Generally, under these agreements, we pay Huntsman LLC an amount equal to its actual costs for providing us with each of these services. In 2003, we paid Huntsman LLC approximately $36 million under these agreements, which we believe to be equivalent to that which would be paid under arrangements with an unaffiliated third-party.
Integration with Huntsman LLC's Amines Businesses
Huntsman LLC produces certain amines. Amines are used to make products used in agricultural herbicides, personal care products, polyurethane foams, fuel and lubricant additives and paints and coatings. We manage certain aspects of Huntsman LLC's amines businesses. We purchase from Huntsman LLC and resell amines produced by Huntsman LLC to be sold outside the Americas. We have also entered into certain related technology licensing arrangements with Huntsman LLC. We believe that these transactions have been made on terms which are no less favorable to us than would be expected from an unaffiliated third- party.
Integration with Huntsman LLC's Surface Sciences Business
Certain other subsidiaries of Huntsman LLC, including Huntsman Petrochemical Corporation and Huntsman Corporation Australia Pty Limited, produce surfactants. We have entered into agreements with those companies covering marketing, technical support, technology licenses, and product purchase and sales agreements. We believe that these transactions have been made on terms which are no less favorable to us than would be expected from an unaffiliated third-party.
Ethylene and Ethylene Oxide Supply
Currently, Huntsman LLC supplies ethylene and ethylene oxide required by us for the operation of our ethyleneamines facility. We pay market prices for the ethylene supplied by Huntsman LLC. In 2003, we spent approximately $15.5 million to purchase ethylene from Huntsman LLC. We believe that these transactions have been made on terms which are no less favorable to us than would be expected from an unaffiliated third-party.
84
Services Contracts
In order to operate our ethyleneamines business, we have entered into a series of contracts with Huntsman LLC that expire in 2012 under which Huntsman LLC operates and maintains our ethyleneamines facility, including the provision of management, personnel, transportation, information systems, accounting, tax and legal services, and research and development. Generally, under these agreements, we pay Huntsman LLC an amount equal to its actual costs for providing us with each of these services. In 2003, we paid Huntsman LLC approximately $9.6 million for these services. We believe that these transactions have been made on terms which are no less favorable to us than would be expected from an unaffiliated third-party.
ITEM 14. PRINCIPAL ACCOUNTANT FEES AND SERVICES
Fees billed to our Company by Deloitte & Touche LLP, the member firms of Deloitte Touche Tohmatsu, and their respective affiliates (collectively, "Deloitte & Touche") for the years ended December 31, 2003 and 2002, respectively, were as follows:
Audit Fees
The aggregate fees billed for the audit of our annual financial statements for the years ended December 31, 2003 and 2002 and for the reviews of the financial statements included in our Quarterly Reports on Form 10-Q and for other attest services primarily related to statutory audits, comfort letters, consents related to SEC and other registration statements were $3.0 million and $2.8 million, respectively.
Audit-Related Fees
The aggregate fees billed for audit-related services for the years ended December 31, 2003 and 2002 were $0.7 million and $0.6 million, respectively. These fees relate primarily to financial accounting and reporting consultations, agreed upon procedures reports and audits of employee benefit plans.
Tax Fees
The aggregate fees billed for tax services for the years ended December 31, 2003 and 2002 were $1.0 million and $1.4 million, respectively. These fees relate to U.S. and foreign tax compliance, tax advice and planning, expatriate tax matters, transfer pricing, and assistance with tax audits.
All Other Fees
The aggregate fees for services not included above were $0.1 million and $0.2 million, respectively, for the years ended December 31, 2003 and 2002 related to miscellaneous services.
85
Our Company has not established an Audit Committee, but the Audit Committee of HIH, our parent company, performs that function for our Company. The Audit Committee has, by resolution, adopted policies and procedures regarding the pre-approval of the performance by Deloitte & Touche of certain audit and non-audit services. Deloitte & Touche may not perform any service enumerated in Section 201(a) of the Sarbanes-Oxley Act of 2002, except as may otherwise be provided by law or regulation. Deloitte & Touche may not perform any service unless the approval of the Audit Committee is obtained prior to the performance of the services, except as may otherwise be provided by law or regulation. The Audit Committee has pre-approved, by category, the performance by Deloitte & Touche of certain audit and accounting services, certain tax services, and, provided that fees do not exceed $250,000 per individual project, certain other tax services and audit-related services. The Audit Committee has delegated to the committee chairperson the power to pre-approve services beyond those previously described, provided that no services may be approved that are prohibited pursuant to Section 201(a) of the Sarbanes-Oxley Act of 2002 or that appear reasonably likely to compromise the independence of Deloitte & Touche. Any pre-approval granted by the chairperson will be reviewed by the Audit Committee at its next regularly scheduled meeting. In addition, the Audit Committee will receive an annual report detailing the prior year's expenditures consistent with the SEC fee disclosure requirements.
ITEM 15. EXHIBITS, FINANCIAL STATEMENT SCHEDULES AND REPORTS ON FORM 8-K
During the quarter ended December 31, 2003, we filed (i) a report on Form 8-K dated November 10, 2003, that sets forth information under Item 12, "Results of Operations and Financial Condition" (the "Initial Report"), and (ii) an amendment to the Initial Report on Form 8-K/A dated November 12, 2003.
| Number |
Description of Exhibits |
|
|---|---|---|
| 3.1 | Certificate of Formation of Huntsman International LLC (incorporated by reference to Exhibit 3.1 to our registration statement on Form S-4 (File No. 333-85141)) | |
3.2 |
Second Amended and Restated Limited Liability Company Agreement of Huntsman International LLC dated December 20, 2001 (incorporated by reference to Exhibit 3.2 to amendment no. 1 to our annual report on Form 10-K/A for the year ended December 31, 2001) |
|
3.3 |
Certificate of Formation of Huntsman International Financial LLC (incorporated by reference to Exhibit 3.3 to our registration statement on Form S-4 (File No. 333-85141)) |
|
86
3.4 |
Limited Liability Company Agreement of Huntsman International Financial LLC dated June 18, 1999, as amended by the First Amendment dated June 19, 1999 (incorporated by reference to Exhibit 3.4 to our registration statement on Form S-4 (File No. 333-85141)) |
|
3.5 |
Memorandum of Association of Tioxide Group (incorporated by reference to Exhibit 3.5 to our registration statement on Form S-4 (File No. 333-85141)) |
|
3.6 |
Articles of Association of Tioxide Group (incorporated by reference to Exhibit 3.6 to our registration statement on Form S-4 (File No. 333-85141)) |
|
3.7 |
Memorandum of Association of Tioxide Americas Inc. (incorporated by reference to Exhibit 3.7 to our registration statement on Form S-4 (File No. 333-85141)) |
|
3.8 |
Articles of Association of Tioxide Americas Inc. (incorporated by reference to Exhibit 3.8 to our registration statement on Form S-4 (File No. 333-85141)) |
|
3.9 |
Certificate of Amendment to Certificate of Formation of Huntsman International LLC (incorporated by reference to Exhibit 3.9 to our annual report on Form 10-K for the year ended December 31, 2000) |
|
3.10 |
Certificate of Amendment to Certificate of Formation of Huntsman International Financial LLC (incorporated by reference to Exhibit 3.10 to our annual report on Form 10-K for the year ended December 31, 2000) |
|
3.11 |
Certificate of Formation of Huntsman Propylene Oxide Holdings LLC (incorporated by reference to Exhibit 3.7 to our registration statement on Form S-4 (File No. 333-58578)) |
|
3.12 |
Limited Liability Company Agreement of Huntsman Propylene Oxide Holdings LLC dated July 12, 2000 (incorporated by reference to Exhibit 3.8 to our registration statement on Form S-4 (File No. 333-58578)) |
|
3.13 |
Certificate of Formation of Huntsman EA Holdings LLC (incorporated by reference to Exhibit 3.9 to our registration statement on Form S-4 (File No. 333-58578)) |
|
3.14 |
Limited Liability Company Agreement of Huntsman EA Holdings LLC dated December 22, 2000 (incorporated by reference to Exhibit 3.10 to our registration statement on Form S-4 (File No. 333-58578)) |
|
3.15 |
Certificate of Formation of Huntsman Texas Holdings LLC (incorporated by reference to Exhibit 3.11 to our registration statement on Form S-4 (File No. 333-58578)) |
|
3.16 |
Limited Liability Company Agreement of Huntsman Texas Holdings LLC dated July 12, 2000 (incorporated by reference to Exhibit 3.12 to our registration statement on Form S-4 (File No. 333-58578)) |
|
3.17 |
Certificate of Formation of Eurofuels LLC (incorporated by reference to Exhibit 3.13 to our registration statement on Form S-4 (File No. 333-58578)) |
|
3.18 |
Limited Liability Company Agreement of Eurofuels LLC dated July 12, 2000 (incorporated by reference to Exhibit 3.14 to our registration statement on Form S-4 (File No. 333-58578)) |
|
3.19 |
Certificate of Formation of Eurostar Industries LLC (incorporated by reference to Exhibit 3.15 to our registration statement on Form S-4 (File No. 333-58578)) |
|
3.20 |
Limited Liability Company Agreement of Eurostar Industries LLC dated July 12, 2000 (incorporated by reference to Exhibit 3.16 to our registration statement on Form S-4 (File No. 333-58578)) |
|
87
3.21 |
Certificate of Limited Partnership of Huntsman Ethyleneamines Ltd. (incorporated by reference to Exhibit 3.17 to our registration statement on Form S-4 (File No. 333-58578)) |
|
3.22 |
Articles of Limited Partnership of Huntsman Ethyleneamines Ltd. dated January 5, 2001 (incorporated by reference to Exhibit 3.18 to our registration statement on Form S-4 (File No. 333-58578)) |
|
3.23 |
Certificate of Limited Partnership of Huntsman Propylene Oxide Ltd. (incorporated by reference to Exhibit 3.19 to our registration statement on Form S-4 (File No. 333-58578)) |
|
3.24 |
First Amended and Restated Articles of Limited Partnership of Huntsman Propylene Oxide Ltd. dated October 1, 2000 (incorporated by reference to Exhibit 3.20 to our registration statement on Form S-4 (File No. 333-58578)) |
|
3.25 |
Certificate of Limited Partnership of Huntsman International Fuels, L.P. (incorporated by reference to Exhibit 3.21 to our registration statement on Form S-4 (File No. 333-58578)) |
|
3.26 |
Certificate of First Amendment to Certificate of Limited Partnership of Huntsman International Fuels, L.P. (incorporated by reference to Exhibit 3.22 to our registration statement on Form S-4 (File No. 333-58578)) |
|
3.27 |
First Amended and Restated Articles of Limited Partnership of Huntsman International Fuels, L.P. dated October 1, 2000 (incorporated by reference to Exhibit 3.23 to our registration statement on Form S-4 (File No. 333-58578)) |
|
4.1 |
Indenture, dated as of June 30, 1999, among Huntsman International LLC (f/k/a Huntsman ICI Chemicals LLC), the Guarantors party thereto and Bank One, N.A., as Trustee, relating to the 101/8% Senior Subordinated Notes due 2009 (incorporated by reference to Exhibit 4.1 to our registration statement on Form S-4 (File No. 333-85141)) |
|
4.2 |
Form of 101/8% Senior Subordinated Note due 2009 denominated in dollars (included as Exhibit A-3 to Exhibit 4.1) |
|
4.3 |
Form of 101/8% Senior Subordinated Note due 2009 denominated in euros (included as Exhibit A-4 to Exhibit 4.1) |
|
4.4 |
Form of Guarantee relating to the 101/8% Senior Subordinated Notes due 2009 (included as Exhibit E of Exhibit 4.1) |
|
4.5 |
First Amendment, dated January 5, 2000, to Indenture, dated as of June 30, 1999, among Huntsman International LLC (f/k/a Huntsman ICI Chemicals LLC), as Issuer, each of the Guarantors named therein and Bank One, N.A., as Trustee (incorporated by reference to Exhibit 4.6 to our registration statement on Form S-4 (File No. 333-85141)) |
|
4.6 |
Indenture, dated as of March 13, 2001, among Huntsman International LLC, as Issuer, the Guarantors named therein and The Bank of New York, as Trustee, relating to 101/8% Senior Subordinated Notes due 2009 (incorporated by reference to Exhibit 4.6 to amendment no. 1 to our annual report on Form 10-K/A for the year ended December 31, 2001) |
|
4.7 |
Form of 101/8% Senior Subordinated Note due 2009 denominated in dollars (included as Exhibit A-3 to Exhibit 4.6) |
|
4.8 |
Form of 101/8% Senior Subordinated Note due 2009 denominated in euros (included as Exhibit A-4 to Exhibit 4.6) |
|
4.9 |
Form of Guarantee relating to the 101/8% Senior Subordinated Notes due 2009 (included as Exhibit E of Exhibit 4.6) |
|
88
4.10 |
First Supplemental Indenture, dated as of January 11, 2002, among Huntsman International LLC, as Issuer, the Guarantors named therein and The Bank of New York, as Trustee, relating to 101/8% Senior Subordinated Notes due 2009 (incorporated by reference to Exhibit 4.7 to amendment no. 1 to our annual report on Form 10- K/A for the year ended December 31, 2001) |
|
4.11 |
Indenture, dated as of March 21, 2002, among Huntsman International LLC, as Issuer, the Guarantors named therein and Wells Fargo Bank Minnesota, National Association, as Trustee, relating to the 97/8% Senior Notes due 2009 (incorporated by reference to Exhibit 4.8 to amendment no. 1 to our annual report on Form 10-K/A for the year ended December 31, 2001) |
|
4.12 |
Form of 97/8% Senior Note due 2009 denominated in dollars (included as Exhibit A-3 to Exhibit 4.11) |
|
4.13 |
Form of 97/8% Senior Note due 2009 denominated in euros (included as Exhibit A-4 to Exhibit 4.11) |
|
4.14 |
Form of Guarantee relating to the 97/8% Senior Notes due 2009 (included as Exhibit E of Exhibit 4.11) |
|
4.15 |
Amended and Restated Guarantee, dated as of April 11, 2003, among the Guarantors named therein and Wells Fargo Bank Minnesota, National Association, as Trustee, relating to the 97/8% Senior Notes due 2009 (incorporated by reference to Exhibit 4.15 to our registration statement on Form S-4 (File No. 333-106482)) |
|
4.16 |
Exchange and Registration Rights Agreement, dated as of March 21, 2002, among Huntsman International LLC, the Guarantors as defined therein, and the Purchasers as defined therein, relating to the 97/8% Senior Notes due 2009 (incorporated by reference to Exhibit 4.9 to amendment no. 1 to our annual report on Form 10-K/A for the year ended December 31, 2001) |
|
4.17 |
Exchange and Registration Rights Agreement, dated as of April 11, 2003, among Huntsman International LLC, the Guarantors, as defined therein, and the Purchasers as defined therein, relating to the 97/8% Senior Notes due 2009 (incorporated by reference to Exhibit 4.17 to our registration statement on Form S-4 (File No. 333-106482)) |
|
10.1 |
Contribution Agreement, dated as of April 15, 1999, by and among Imperial Chemical Industries PLC, Huntsman Specialty Chemicals Corporation, Huntsman International Holdings LLC (f/k/a Huntsman ICI Holdings LLC) and Huntsman International LLC (f/k/a Huntsman ICI Chemicals LLC) as amended by the first Amending Agreement, dated June 4, 1999, the second Amending Agreement, dated June 30, 1999, and the third Amending Agreement, dated June 30, 1999 (incorporated by reference to Exhibit 10.1 to our registration statement on Form S-4 (File No. 333-85141)) |
|
10.2 |
Purchase and Sale Agreement (PO/MTBE Business), dated March 21, 1997, among Texaco, Texaco Chemical Inc. and Huntsman Specialty Chemicals Corporation (incorporated by reference to Exhibit 10.2 to our registration statement on Form S-4 (File No. 333-85141)) |
|
10.3 |
Operating and Maintenance Agreement, dated as of March 21, 1997, by and between Huntsman Specialty Chemicals Corporation and Huntsman Petrochemical Corporation (incorporated by reference to Exhibit 10.3 to our registration statement on Form S-4 (File No. 333-85141)) |
|
89
10.4 |
Credit Agreement, dated as of June 30, 1999, by and among Huntsman International LLC (f/k/a Huntsman ICI Chemicals LLC), Huntsman International Holdings LLC (f/k/a Huntsman ICI Holdings LLC), Bankers Trust Company, Goldman Sachs Credit Partners LP, The Chase Manhattan Bank, and Warburg Dillon Read and various lending institutions party thereto (incorporated by reference to Exhibit 10.4 to our registration statement on Form S-4 (File No. 333-85141)) |
|
10.5 |
Asset Sale Agreement, dated June 30, 1999, by and between BP Chemicals Limited and Huntsman International LLC (f/k/a Huntsman ICI Chemicals LLC) (incorporated by reference to Exhibit 10.5 to our registration statement on Form S-4 (File No. 333-85141)) |
|
10.6 |
First Amendment, dated as of December 21, 2000, by and among Huntsman International LLC, Huntsman International Holdings LLC, the financial institutions named therein, as Lenders, Bankers Trust Company, as Lead Arranger, Administrative Agent for the Lenders and Sole Book Manager, Goldman Sachs Credit Partners L.P., as Syndication Agent and Co-Arranger and The Chase Manhattan Bank and Warburg Dillon Read (a division of UBS AG), as Co-Arrangers and as Co-Documentation Agents, to the Credit Agreement dated as of June 30, 1999 (incorporated by reference to Exhibit 10.15 to our annual report on Form 10-K for the year ended December 31, 2000) |
|
10.7 |
Second Amendment, dated as of March 5, 2001, is entered into by and among Huntsman International LLC, Huntsman International Holdings LLC, the undersigned financial institutions, including Bankers Trust Company, in their capacities as lenders hereunder, Bankers Trust Company, as Lead Arranger, Administrative Agent for the Lenders and Sole Book Manager, Goldman Sachs Credit Partners L.P., as Syndication Agent and Co-Arranger and The Chase Manhattan Bank and UBS Warburg LLC (as successor to Warburg Dillon Read), as Co-Arrangers and as Co-Documentation Agents, to the Credit Agreement dated as of June 30, 1999 (incorporated by reference to Exhibit 10.16 to our annual report on Form 10-K for the year ended December 31, 2000) |
|
10.8 |
Contribution Agreement, among Huntsman International LLC, as Contributor and Originator, and Huntsman Receivables Finance LLC, as the Company, dated as of December 20, 2000 (incorporated by reference to Exhibit 10.17 to our annual report on Form 10-K for the year ended December 31, 2000) |
|
10.9 |
Huntsman Master Trust Pooling Agreement, dated as of December 21, 2000, among Huntsman Receivables Finance LLC, as Company, Huntsman (Europe) BVBA, as Master Servicer, and Chase Manhattan Bank (Ireland) Plc, as Trustee (incorporated by reference to Exhibit 10.18 to our annual report on Form 10-K for the year ended December 31, 2000) |
|
10.10 |
Huntsman Master Trust, Series 2000-1 Supplement, dated as of December 21, 2000, to Pooling Agreement dated as of December 21, 2000, among Huntsman Receivables Finance LLC, as Company, Huntsman (Europe), BVBA, as Master Servicer, The Chase Manhattan Bank, as Funding Agent, Park Avenue Receivables Corp., as Series 2000-1 Initial Purchaser, the several financial institutions party thereto from time to time as Series 2000-1 APA Banks, and Chase Manhattan Bank (Ireland) Plc, as Trustee (incorporated by reference to Exhibit 10.19 to our annual report on Form 10-K for the year ended December 31, 2000) |
|
90
10.11 |
Servicing Agreement, dated as of December 21, 2000, among Huntsman Receivables Finance LLC, as the Company, Huntsman (Europe) BVBA, as Master Servicer, Tioxide Americas Inc., Huntsman ICI Holland B.V., Tioxide Europe Limited, Huntsman International LLC, Huntsman Petrochemicals (U.K.) Limited, Huntsman Propylene Oxide Ltd., Huntsman International Fuels L.P., as Local Servicers, Chase Manhattan Bank (Ireland) Plc, as Trustee, Pricewaterhousecoopers, as Liquidation Servicer, and Huntsman International LLC, as Servicer Guarantor (incorporated by reference to Exhibit 10.20 to our annual report on Form 10-K for the year ended December 31, 2000) |
|
10.12 |
U.S. Receivables Purchase Agreement, Huntsman International LLC, as Purchaser, and Tioxide Americas Inc., Huntsman Propylene Oxide Ltd. and Huntsman International Fuels, L.P., each as a Seller and an Originator (incorporated by reference to Exhibit 10.21 to our annual report on Form 10-K for the year ended December 31, 2000) |
|
10.13 |
Dutch Receivables Purchase Agreement, dated as of December 21, 2000, between Huntsman International LLC, as Purchaser, Huntsman ICI Holland B.V., as Originator, Huntsman ICI (Europe) B.V.B.A., as Master Servicer (incorporated by reference to Exhibit 10.22 to our annual report on Form 10-K for the year ended December 31, 2000) |
|
10.14 |
U.K. Receivables Purchase Agreement, dated as of December 20, 2000, between Huntsman International LLC, as Purchaser, Tioxide Europe Limited and Huntsman Petrochemicals (U.K.) Limited, as Originators, and Huntsman (Europe) B.V.B.A., as Master Servicer (incorporated by reference to Exhibit 10.23 to our annual report on Form 10-K for the year ended December 31, 2000) |
|
10.15 |
Third Amendment, dated as of November 30, 2001, by and among Huntsman International LLC, Huntsman International Holdings LLC and the various agents and lending institutions party thereto (incorporated by reference to Exhibit 10.1 to our current report on Form 8-K filed December 4, 2001) |
|
10.16 |
Fourth Amendment to Credit Agreement, dated as of March 15, 2002, by and among Huntsman International LLC, Huntsman International Holdings LLC and the various agents and lending institutions party thereto (incorporated by reference to Exhibit 10.25 to amendment no. 1 to our annual report on Form 10-K/A for the year ended December 31, 2001) |
|
10.17 |
Amendment Agreement, dated December 20, 2001, between Imperial Chemical Industries PLC, Huntsman Specialty Chemicals Corporation, Huntsman International Holdings LLC and Huntsman International LLC, to amend the Contribution Agreement dated as of April 15, 1999 (incorporated by reference to Exhibit 10.26 to our registration statement on Form S-4 (File No. 333-106482)) |
|
10.18 |
Second Amendment, dated as of October 21, 2002, between Huntsman Receivables Finance LLC, Huntsman (Europe), BVBA, and J.P. Morgan (Ireland) PLC, to Series 2000-1 Supplement, dated as of December 21, 2000 (incorporated by reference to Exhibit 10.27 to our annual report on Form 10-K for the year ended December 31, 2002) |
|
10.19 |
First Amendment to Series 2001-1 Supplement, dated as of October 21, 2002, among Huntsman Receivables Finance LLC, Huntsman (Europe) BVBA and J.P. Morgan Bank (Ireland) PLC (incorporated by reference to Exhibit 10.28 to our annual report on Form 10-K for the year ended December 31, 2002) |
|
91
10.20 |
First Amendment to Amended and Restated Pooling Agreement, dated as of October 21, 2002, among Huntsman Receivables Finance LLC, Huntsman (Europe) BVBA and J.P. Morgan Bank (Ireland) PLC (incorporated by reference to Exhibit 10.29 to our annual report on Form 10-K for the year ended December 31, 2002) |
|
10.21 |
Amended and Restated Servicing Agreement, dated as of October 21, 2002, among Huntsman Receivables Finance LLC, as the Company, Huntsman (Europe) BVBA, as Master Servicer, Tioxide Americas Inc., Huntsman Holland B.V., Tioxide Europe Limited, Huntsman International LLC, Huntsman Petrochemicals (UK) Limited, Huntsman Propylene Oxide Ltd., Huntsman International Fuels L.P., Tioxide Europe SRL, Huntsman Surface Sciences Italia SRL, Huntsman Patrica S.R.L., Tioxide Europe S.L., Huntsman Surface Sciences Ibérica, S.L., Tioxide Europe SAS, Huntsman Surface Sciences (France) S.A.S., Huntsman Surface Sciences UK Ltd, Huntsman Ethyleneamines Ltd., as Local Servicers, J.P. Morgan Bank (Ireland) PLC, as Trustee, Pricewaterhousecoopers, as Liquidation Servicer, and Huntsman International LLC, as Servicer Guarantor (incorporated by reference to Exhibit 10.30 to our annual report on Form 10-K for the year ended December 31, 2002) |
|
10.22 |
Amended and Restated U.S. Receivables Purchase Agreement, dated as of October 21, 2002, among Huntsman International LLC, as Purchaser, and Tioxide Americas Inc., Huntsman Propylene Oxide Ltd., Huntsman International Fuels L.P., and Huntsman Ethyleneamines Ltd., each as a Seller and an Originator (incorporated by reference to Exhibit 10.31 to our annual report on Form 10-K for the year ended December 31, 2002) |
|
10.23 |
Amended and Restated UK Receivables Purchase Agreement, dated as of October 21, 2002, among Huntsman International LLC, as Purchaser, Huntsman Surface Sciences UK Limited, Tioxide Europe Limited, and Huntsman Petrochemicals (UK) Limited, as Originators, Huntsman (Europe) B.V.B.A, as Master Servicer (incorporated by reference to Exhibit 10.32 to our annual report on Form 10-K for the year ended December 31, 2002) |
|
10.24 |
Fifth Amendment to Credit Agreement, dated as of February 7, 2003, among Huntsman International LLC, Huntsman International Holdings LLC and the various agents and lending institutions party thereto (incorporated by reference to Exhibit 10.33 to our annual report on Form 10-K for the year ended December 31, 2002) |
|
10.25 |
Deed of Amendment to Contribution Agreement, dated as of November 27, 2002, among Imperial Chemical Industries PLC, Huntsman Specialty Chemicals Corporation, Huntsman International Holdings, LLC, and Huntsman International LLC (incorporated by reference to Exhibit 10.34 to our annual report on Form 10-K for the year ended December 31, 2002) |
|
10.26 |
Sixth Amendment to Credit Agreement, dated as of April 9, 2003, among Huntsman International LLC, Huntsman International Holdings LLC and the various agents and lending institutions party thereto (incorporated by reference to Exhibit 10.1 to our quarterly report on Form 10-Q for the quarter ended March 31, 2003) |
|
10.27 |
Business Consulting Agreement, dated as of June 3, 2003, between Huntsman International LLC and Jon M. Huntsman (incorporated by reference to Exhibit 10.41 to our registration statement on Form S-4 (File No. 333-106482)) |
|
10.28 |
Seventh Amendment to Credit Agreement, dated as of October 17, 2003, among Huntsman International LLC, Huntsman International Holdings LLC and the various agents and lending institutions party thereto (incorporated by reference to Exhibit 10.42 to our registration statement on Form S-4 (File No. 333-106482)) |
|
14.1 |
Financial Code of Ethics |
|
92
21.1 |
Subsidiaries of Huntsman International LLC |
|
31.1 |
Certification of Chief Executive Officer pursuant to Section 302 of the Sarbanes-Oxley Act of 2002 |
|
31.2 |
Certification of Chief Financial Officer pursuant to Section 302 of the Sarbanes-Oxley Act of 2002 |
|
32.1 |
Certifications of Chief Executive Officer pursuant to Section 906 of the Sarbanes-Oxley Act of 2002 |
|
32.2 |
Certifications of Chief Financial Officer pursuant to Section 906 of the Sarbanes-Oxley Act of 2002 |
93
Pursuant to the requirements of Section 13 or 15(d) of the Securities Exchange Act of 1934, the Registrant has duly caused this report to be signed on its behalf by the undersigned, thereunto duly authorized.
| HUNTSMAN INTERNATIONAL LLC | |||
Dated: March 30, 2004 |
By: |
/s/ J. KIMO ESPLIN J. Kimo Esplin Executive Vice President and Chief Financial Officer |
|
Pursuant to the requirements of the Securities Exchange Act of 1934, this report has been signed by the following persons on behalf of the Registrant and in the capacities indicated on the 30th day of March, 2004:
| Name |
Capacities |
|
|---|---|---|
| /s/ JON M. HUNTSMAN Jon M. Huntsman |
Chairman of the Board and Manager | |
/s/ PETER R. HUNTSMAN Peter R. Huntsman |
President and Chief Executive Officer and Manager (Principal Executive Officer) |
|
/s/ J. KIMO ESPLIN J. Kimo Esplin |
Executive Vice President and Chief Financial Officer (Principal Financial and Accounting Officer) |
94
SUPPLEMENTAL INFORMATION TO BE FURNISHED WITH REPORTS FILED PURSUANT TO SECTION 15 (d) OF THE SECURITIES EXCHANGE ACT OF 1934 BY REGISTRANTS WHICH HAVE NOT REGISTERED SECURITIES PURSUANT TO SECTION 12 OF THE SECURITIES EXCHANGE ACT OF 1934
The registrant has not sent to its security holders any annual report to security holders covering the registrants last fiscal year or any proxy statement, form of proxy or other proxy soliciting material sent to more than 10 of the registrant's security holders with respect to any annual or other meeting of security holders.
95
HUNTSMAN INTERNATIONAL LLC AND SUBSIDIARIES
ITEMS 8 AND 15(a)
INDEX TO CONSOLIDATED FINANCIAL STATEMENTS
F-1
RESPONSIBILITY FOR THE CONSOLIDATED FINANCIAL STATEMENTS
Company management is responsible for the preparation, accuracy and integrity of the consolidated financial statements and other financial information included in this Annual Report. This responsibility includes preparing the statements in accordance with accounting principles generally accepted in the United States of America and necessarily includes estimates based upon management's best judgment.
To help ensure the accuracy and integrity of Company financial data, management maintains internal controls which are designed to provide reasonable assurance that transactions are executed as authorized, that they are accurately recorded and that assets are properly safeguarded. It is essential for all Company employees to conduct their business affairs in keeping with the highest ethical standards as outlined in our code of conduct policy, "Business Conduct Guidelines." Careful selection of employees, and appropriate divisions of responsibility also help us to achieve our control objectives.
The consolidated balance sheets of Huntsman International LLC and subsidiaries as of December 31, 2003 and 2002, and the related consolidated statements of operations and comprehensive income (loss), member's equity, and cash flows for the years ended December 31, 2003, 2002 and 2001 have been audited by the Company's independent accountants Deloitte & Touche LLP. Their report is shown on page F-3.
The Board of Managers oversees the adequacy of the Company's control environment. Representatives of the Audit Committee meet periodically with representatives of Deloitte & Touche LLP, internal financial management and the internal auditor to review accounting, control, auditing and financial reporting matters. The independent accountants and the internal auditor also have full and free access to meet privately with the Audit Committee.
F-2
To the Board of Managers and Member of
Huntsman International LLC
We have audited the accompanying consolidated balance sheets of Huntsman International LLC and subsidiaries (the "Company") as of December 31, 2003 and 2002, and the related consolidated statements of operations and comprehensive income (loss), member's equity, and cash flows for the each of the three years in the period ended December 31, 2003. Our audits also included the financial statement schedule listed in the index. These financial statements and financial statement schedule are the responsibility of the Company's management. Our responsibility is to express an opinion on these financial statements and financial statement schedule based on our audits.
We conducted our audits in accordance with auditing standards generally accepted in the United States of America. Those standards require that we plan and perform the audit to obtain reasonable assurance about whether the financial statements are free of material misstatement. An audit includes examining, on a test basis, evidence supporting the amounts and disclosures in the financial statements. An audit also includes assessing the accounting principles used and significant estimates made by management as well as evaluating the overall financial statement presentation. We believe that our audits provide a reasonable basis for our opinion.
In our opinion, such consolidated financial statements present fairly, in all material respects, the financial position of Huntsman International LLC and subsidiaries at December 31, 2003 and 2002 and the results of their operations and their cash flows for each of the three years in the period ended December 31, 2003 in conformity with accounting principles generally accepted in the United States of America. Also, in our opinion, such financial statement schedule, when considered in relation to the basic consolidated financial statements taken as a whole, presents fairly in all material respects the information set forth therein.
As discussed in Note 2 to the consolidated financial statements, the Company adopted Statement of Financial Accounting Standards, No. 142 effective January 1, 2002 and changed its method of accounting for derivative financial instruments effective January 1, 2001, to conform to Statement of Financial Accounting Standards No. 133, as amended.
DELOITTE & TOUCHE LLP
Salt Lake City, Utah
March 29, 2004
F-3
HUNTSMAN INTERNATIONAL LLC AND SUBSIDIARIES
CONSOLIDATED BALANCE SHEETS
(Dollars in Millions)
| |
December 31, 2003 |
December 31, 2002 |
|||||||
|---|---|---|---|---|---|---|---|---|---|
| ASSETS | |||||||||
| Current assets: | |||||||||
| Cash and cash equivalents | $ | 97.8 | $ | 75.4 | |||||
| Accounts receivable (net of allowance for doubtful accounts of $13.4 and $14.5, respectively) | 564.4 | 473.9 | |||||||
| Inventories | 596.9 | 561.3 | |||||||
| Prepaid expenses | 23.6 | 22.0 | |||||||
| Deferred income taxes | 3.0 | 31.2 | |||||||
| Other current assets | 83.6 | 69.4 | |||||||
| Total current assets | 1,369.3 | 1,233.2 | |||||||
| Property, plant and equipment, net | 3,256.2 | 3,071.1 | |||||||
| Investment in unconsolidated affiliates | 138.7 | 133.9 | |||||||
| Intangible assets, net | 283.4 | 302.8 | |||||||
| Other noncurrent assets | 445.1 | 426.3 | |||||||
| Total assets | $ | 5,492.7 | $ | 5,167.3 | |||||
| LIABILITIES AND MEMBER'S EQUITY | |||||||||
| Current liabilities: | |||||||||
| Accounts payable (including overdraft facilities of $7.5 as of December 31, 2003) | $ | 561.3 | $ | 568.7 | |||||
| Accrued liabilities | 387.7 | 298.6 | |||||||
| Current portion of long-term debt | 1.8 | 43.9 | |||||||
| Total current liabilities | 950.8 | 911.2 | |||||||
| Long-term debt | 2,925.3 | 2,729.9 | |||||||
| Deferred income taxes | 234.8 | 215.1 | |||||||
| Other noncurrent liabilities | 224.5 | 245.8 | |||||||
| Total liabilities | 4,335.4 | 4,102.0 | |||||||
| Minority interests | 3.6 | 0.1 | |||||||
| Commitments and contingencies (Notes 17 and 18) | |||||||||
| Member's equity: | |||||||||
| Member's equity, 1,000 units | 1,026.1 | 1,026.1 | |||||||
| Retained earnings | 55.6 | 186.5 | |||||||
| Accumulated other comprehensive income (loss) | 72.0 | (147.4 | ) | ||||||
| Total member's equity | 1,153.7 | 1,065.2 | |||||||
| Total liabilities and member's equity | $ | 5,492.7 | $ | 5,167.3 | |||||
See accompanying notes to consolidated financial statements.
F-4
HUNTSMAN INTERNATIONAL LLC AND SUBSIDIARIES
CONSOLIDATED STATEMENTS OF OPERATIONS AND
COMPREHENSIVE INCOME (LOSS)
(Dollars in Millions)
| |
Year Ended December 31, 2003 |
Year Ended December 31, 2002 |
Year Ended December 31, 2001 |
|||||||||
|---|---|---|---|---|---|---|---|---|---|---|---|---|
| Revenues: | ||||||||||||
| Trade sales | $ | 5,035.2 | $ | 4,159.9 | $ | 4,178.2 | ||||||
| Related party sales | 203.8 | 333.7 | 376.0 | |||||||||
| Tolling fees | 6.5 | 24.5 | 21.0 | |||||||||
| Total revenues | 5,245.5 | 4,518.1 | 4,575.2 | |||||||||
| Cost of goods sold | 4,661.1 | 3,902.7 | 3,990.1 | |||||||||
| Gross profit | 584.4 | 615.4 | 585.1 | |||||||||
| Expenses: | ||||||||||||
| Selling, general and administrative | 302.4 | 325.0 | 304.8 | |||||||||
| Research and development | 49.4 | 54.6 | 62.5 | |||||||||
| Restructuring and plant closing costs | 56.7 | 7.7 | 46.6 | |||||||||
| Total expenses | 408.5 | 387.3 | 413.9 | |||||||||
| Operating income | 175.9 | 228.1 | 171.2 | |||||||||
| Interest expense | (255.2 | ) | (247.0 | ) | (243.0 | ) | ||||||
| Interest income | 3.7 | 1.6 | 3.4 | |||||||||
| Loss on accounts receivable securitization program | (32.4 | ) | (5.5 | ) | (12.8 | ) | ||||||
| Other income (expense) | (1.3 | ) | 1.3 | (2.0 | ) | |||||||
| Loss before income taxes, minority interest and cumulative effect of accounting change | (109.3 | ) | (21.5 | ) | (83.2 | ) | ||||||
| Income tax benefit (expense) | (21.6 | ) | 41.5 | 26.0 | ||||||||
| Minority interests | — | 0.1 | (2.2 | ) | ||||||||
| Income (loss) before accounting change | (130.9 | ) | 20.1 | (59.4 | ) | |||||||
| Cumulative effect of accounting change | — | — | (1.5 | ) | ||||||||
| Net income (loss) | (130.9 | ) | 20.1 | (60.9 | ) | |||||||
| Other comprehensive income (loss) | 219.4 | 53.4 | (80.1 | ) | ||||||||
| Comprehensive income (loss) | $ | 88.5 | $ | 73.5 | $ | (141.0 | ) | |||||
See accompanying notes to consolidated financial statements.
F-5
HUNTSMAN INTERNATIONAL LLC AND SUBSIDIARIES
CONSOLIDATED STATEMENTS OF MEMBER'S EQUITY
(Dollars in Millions)
| |
Member's Equity |
|
Accumulated Other Comprehensive Income (Loss) |
|
|||||||||||
|---|---|---|---|---|---|---|---|---|---|---|---|---|---|---|---|
| |
Retained Earnings |
|
|||||||||||||
| |
Units |
Amount |
Total |
||||||||||||
| Balance, January 1, 2001 | 1,000 | $ | 1,026.1 | $ | 223.3 | $ | (120.7 | ) | $ | 1,128.7 | |||||
Refund of distribution from HIH |
— |
4.0 |
— |
4.0 |
|||||||||||
| Net loss | — | (60.9 | ) | — | (60.9 | ) | |||||||||
| Other comprehensive loss | — | — | (80.1 | ) | (80.1 | ) | |||||||||
| Balance, December 31, 2001 | 1,000 | 1,026.1 | 166.4 | (200.8 | ) | 991.7 | |||||||||
| Net income | — | 20.1 | — | 20.1 | |||||||||||
| Other comprehensive income | — | — | 53.4 | 53.4 | |||||||||||
| Balance, December 31, 2002 | 1,000 | 1,026.1 | 186.5 | (147.4 | ) | 1,065.2 | |||||||||
| Net loss | — | (130.9 | ) | — | (130.9 | ) | |||||||||
| Other comprehensive income | — | — | 219.4 | 219.4 | |||||||||||
| Balance, December 31, 2003 | 1,000 | $ | 1,026.1 | $ | 55.6 | $ | 72.0 | $ | 1,153.7 | ||||||
See accompanying notes to consolidated financial statements.
F-6
HUNTSMAN INTERNATIONAL LLC AND SUBSIDIARIES
CONSOLIDATED STATEMENTS OF CASH FLOWS
(Dollars in Millions)
| |
Year Ended December 31, 2003 |
Year Ended December 31, 2002 |
Year Ended December 31, 2001 |
||||||||
|---|---|---|---|---|---|---|---|---|---|---|---|
| Cash Flows From Operating Activities: | |||||||||||
| Net income (loss) | $ | (130.9 | ) | $ | 20.1 | $ | (60.9 | ) | |||
| Adjustments to reconcile net income (loss) to net cash provided by operating activities: | |||||||||||
| Depreciation and amortization | 277.9 | 256.2 | 229.0 | ||||||||
| Provision for losses on accounts receivable | 10.2 | 4.1 | 2.8 | ||||||||
| Noncash restructuring and plant closing charges | 11.4 | 6.1 | 7.8 | ||||||||
| Noncash interest expense | 16.2 | 12.9 | 11.3 | ||||||||
| Deferred income taxes | — | (59.8 | ) | (43.1 | ) | ||||||
| Gain on foreign currency transactions | (91.9 | ) | (48.3 | ) | (4.8 | ) | |||||
| Loss on disposal of fixed assets | — | — | 6.6 | ||||||||
| Minority interests in subsidiaries | — | (0.1 | ) | 2.2 | |||||||
| Equity in earnings of investment in unconsolidated affiliates | — | (0.2 | ) | (0.1 | ) | ||||||
| Changes in operating assets and liabilities: | |||||||||||
| Accounts receivable | (14.4 | ) | 39.5 | 161.7 | |||||||
| Change in receivables sold, net | 4.0 | 60.0 | (48.0 | ) | |||||||
| Inventories | 26.6 | (12.6 | ) | 17.3 | |||||||
| Prepaid expenses | 1.1 | (9.1 | ) | 4.5 | |||||||
| Other current assets | (29.2 | ) | (15.0 | ) | 1.7 | ||||||
| Other noncurrent assets | — | (9.4 | ) | 10.3 | |||||||
| Accounts payable | (58.5 | ) | (0.5 | ) | (106.7 | ) | |||||
| Accrued liabilities | 32.6 | (70.2 | ) | 21.3 | |||||||
| Other noncurrent liabilities | (6.6 | ) | (16.2 | ) | (10.5 | ) | |||||
| Net cash provided by operating activities | 48.5 | 157.5 | 202.4 | ||||||||
| Investing Activities: | |||||||||||
| Capital expenditures | (127.4 | ) | (190.5 | ) | (291.0 | ) | |||||
| Acquisitions of businesses and minority interest | — | (9.0 | ) | (209.5 | ) | ||||||
| Investment in unconsolidated affiliate | (6.1 | ) | — | — | |||||||
| Net cash received from unconsolidated affiliates | 0.8 | 8.0 | 11.3 | ||||||||
| Advances to unconsolidated affiliates | (3.0 | ) | (3.3 | ) | (2.5 | ) | |||||
| Proceeds from sale of fixed assets | — | 5.9 | — | ||||||||
| Net cash used in investing activities | (135.7 | ) | (188.9 | ) | (491.7 | ) | |||||
| Financing Activities: | |||||||||||
| Net borrowings (repayments) under revolving loan facilities | (45.0 | ) | (43.6 | ) | 79.5 | ||||||
| Issuance of senior notes | 157.9 | 300.0 | 233.2 | ||||||||
| Proceeds from other long-term debt | 205.0 | — | 4.4 | ||||||||
| Repayment of long-term debt | (264.0 | ) | (245.0 | ) | (2.4 | ) | |||||
| Net borrowings under overdraft facility | 7.5 | — | — | ||||||||
| Shares of subsidiary issued to minorities for cash | 2.7 | — | — | ||||||||
| Debt issuance costs | (9.7 | ) | (10.3 | ) | (6.5 | ) | |||||
| Refund of distribution from HIH | — | — | 4.0 | ||||||||
| Net cash provided by financing activities | 54.4 | 1.1 | 312.2 | ||||||||
| Effect of exchange rate changes on cash | 55.2 | 21.8 | (5.1 | ) | |||||||
| Increase (decrease) in cash and cash equivalents | 22.4 | (8.5 | ) | 17.8 | |||||||
| Cash and cash equivalents at beginning of period | 75.4 | 83.9 | 66.1 | ||||||||
| Cash and cash equivalents at end of period | $ | 97.8 | $ | 75.4 | $ | 83.9 | |||||
| Supplemental cash flow information: | |||||||||||
| Cash paid for interest | $ | 222.5 | $ | 235.0 | $ | 222.2 | |||||
| Cash paid for income taxes | $ | 13.8 | $ | 12.3 | $ | 15.0 | |||||
Supplemental non-cash financing activities:
The Company partially finances its property and liability insurance premiums. During the years ended December 31, 2003 and 2002,
the Company issued notes
payable for approximately $5.2 million and $2.6 million, respectively, and recorded prepaid insurance for the same amount, which will be amortized over the period covered.
See accompanying notes to consolidated financial statements.
F-7
HUNTSMAN INTERNATIONAL LLC AND SUBSIDIARIES
NOTES TO CONSOLIDATED FINANCIAL STATEMENTS
1. Basis of Presentation
Huntsman International LLC (the "Company") is a global manufacturer and marketer of differentiated and commodity chemicals through its four principal businesses: Polyurethanes, Performance Products, Pigments and Base Chemicals. The Company is a wholly-owned subsidiary of Huntsman International Holdings LLC ("HIH"). All of the membership interests of HIH are owned directly and indirectly by HMP Equity Holdings Corporation ("HMP"). HMP is 100% owned by Huntsman Group Inc. ("HGI"), subject to warrants which, if exercised, would entitle the holders thereof to up to 12% of the common equity of HMP. HGI is 100% owned by Huntsman Holdings, LLC ("Huntsman Holdings"). The voting membership interests of Huntsman Holdings are owned by the Huntsman family, MatlinPatterson Global Opportunities Partners, L.P. ("GOP"), Consolidated Press (Finance) Limited ("CPH") and certain members of senior management. In addition, Huntsman Holdings has issued certain non-voting preferred units to Huntsman Holdings Preferred Member LLC, which, in turn, is owned by GOP (indirectly), CPH, the Huntsman Cancer Foundation, certain members of senior management and certain members of the Huntsman family. Huntsman Holdings has also issued certain non-voting preferred units to the Huntsman family, GOP, and CPH that track the performance of the Huntsman Advanced Materials LLC ("AdMat") business. The Huntsman family has board and operational control of the Company.
In February 2001, we completed our acquisition of the global ethyleneamines business of Dow Chemical Company, and in April 2001, we completed our acquisition of the Albright & Wilson European surfactants business from Rhodia S.A.
2. Summary of Significant Accounting Policies
Principles of Consolidation
The consolidated financial statements of the Company include its majority owned subsidiaries. Intercompany transactions and balances are eliminated.
Use of Estimates
The preparation of financial statements in conformity with accounting principles generally accepted in the United States of America requires management to make estimates and assumptions that affect the reported amounts of assets and liabilities and disclosure of contingent assets and liabilities at the date of the financial statements and the reported amounts of revenues and expenses during the reporting period. Actual results could differ from those estimates.
Cash and Cash Equivalents
Highly liquid investments with an original maturity of three months or less when purchased are considered to be cash equivalents.
Securitization of Accounts Receivable
The Company securitizes certain trade receivables in connection with a revolving accounts receivable securitization program in which the Company grants a participating undivided interest in certain of its trade receivables to a qualified off-balance sheet entity. The Company retains the servicing rights and a retained interest in the securitized receivables. Losses are recorded on the sale and are based on the carrying value of the receivables as allocated between the receivables sold and the
F-8
retained interests and their relative fair value at the date of the transfer. Retained interests are subsequently carried at fair value which is estimated based on the present value of expected cash flows, calculated using management's best estimates of key assumptions including credit losses and discount rates commensurate with the risks involved. For more information, see "Note 11 Securitization of Accounts Receivable" below.
Inventories
Inventories are stated at the lower of cost or market using the weighted average method.
Property, Plant and Equipment
Property, plant and equipment is stated at cost. Depreciation is provided utilizing the straight line method over the estimated useful lives:
| Buildings | 20-30 years | |
| Plant and equipment | 3-20 years |
Upon disposal of assets, the cost and related accumulated depreciation are removed from the accounts and the resulting gain or loss is included in income.
Periodic maintenance and repairs applicable to major units of manufacturing facilities are accounted for on the prepaid basis by capitalizing the costs of the turnaround and amortizing the costs over the estimated period until the next turnaround. The Company does not accrue for any items of repair or maintenance in advance of incurring the cost. Normal maintenance and repairs of all other plant and equipment are charged to expense as incurred. Renewals, betterments and major repairs that materially extend the useful life of the assets are capitalized, and the assets replaced, if any, are retired.
Interest costs are capitalized as part of major construction projects. Interest expense capitalized as part of plant and equipment was $4.4 million, $10.5 million, and $9.3 million for the years ended December 31, 2003, 2002 and 2001, respectively.
Investment in Unconsolidated Affiliates
Investments in companies in which the Company exercises significant influence, generally ownership interests from 20% to 50%, are accounted for using the equity method.
Intangible Assets
Intangible assets, which consist of patents, trademarks, technology and certain other agreements, are stated at their fair market values at the time of acquisition, and are amortized using the straight-line method over their estimated useful lives of five to fifteen years or over the life of the related agreement.
Carrying Value of Long-term Assets
The Company evaluates the carrying value of long-term assets based upon current and anticipated undiscounted cash flows and recognizes an impairment when such estimated cash flows will be less than
F-9
the carrying value of the asset. Measurement of the amount of impairment, if any, is based upon the difference between carrying value and fair value.
Financial Instruments
The carrying amount reported in the balance sheet for cash and cash equivalents, accounts receivable and accounts payable approximates fair value because of the immediate or short-term maturity of these financial instruments. The carrying value of the Company's senior credit facilities approximates fair value since they bear interest at a floating rate plus an applicable margin. At December 31, 2003, the fair value of the Company's senior unsecured notes was $490.5 million. At December 31, 2002 the fair value of the Company's senior unsecured notes approximated book value. The fair value of the Company's senior subordinated notes was $1,204.9 million and $893.7 million at December 31, 2003 and 2002, respectively.
Derivatives and Hedging Activities
Effective January 1, 2001, the Company adopted Statement of Financial Accounting Standards ("SFAS") No. 133, "Accounting for Derivative Instruments and Hedging Activities." SFAS No. 133 (as amended) requires that an entity recognize all derivative instruments as assets or liabilities in the balance sheet and measure those instruments at fair value. The accounting for the change in the fair value depends on the use of the instrument. The adoption of SFAS No. 133 resulted in a cumulative increase in net loss of $1.5 million and a cumulative increase to accumulated other comprehensive loss of $1.1 million for the year ended December 31, 2001. For more information, see "Note 13—Derivative Instruments and Hedging Activities."
Income Taxes
The Company and its U.S. subsidiaries are organized as limited liability companies. These entities are treated similar to a partnership for U.S. income tax purposes, and therefore are not subject to U.S. federal tax on their income. Subsidiaries outside the U.S. are generally taxed on the income generated in the local country.
Deferred income taxes are provided for temporary differences between financial statement income and taxable income using the asset and liability method in accordance with SFAS No. 109, "Accounting for Income Taxes." The Company evaluates the resulting deferred tax assets to determine whether it is more likely than not that they will be realized. Valuation allowances have been established against certain of the international deferred tax assets due to uncertainty of realization. The Company does not provide for income taxes or benefits on the undistributed earnings of its international subsidiaries as earnings are reinvested and, in the opinion of management, will continue to be reinvested indefinitely.
Environmental Expenditures
Environmental related restoration and remediation costs are recorded as liabilities and expensed when site restoration and environmental remediation and cleanup obligations are either known or considered probable and the related costs can be reasonably estimated. Other environmental expenditures, which are principally maintenance or preventative in nature, are recorded when incurred and are expensed or capitalized as appropriate.
F-10
Foreign Currency Translation
Generally, the accounts of the Company's subsidiaries outside of the United States consider local currency to be functional currency. Accordingly, assets and liabilities are translated at rates prevailing at the balance sheet date. Revenues, expenses, gains and losses are translated at a weighted average rate for the period. Cumulative translation adjustments are recorded to equity as a component of accumulated other comprehensive income. Transaction gains and losses are recorded in selling, general and administrative expenses in the consolidated statement of operations and were net gains of $91.9 million, $48.3 million and $4.8 million for the years ended December 31, 2003, 2002 and 2001, respectively.
Revenue Recognition
The Company generates revenues through sales in the open market and long-term supply contracts. The Company recognizes revenue when it is realized or realizable and earned. Revenue for product sales is recognized as risk and title to the product transfers to the customer, collectibility is reasonably assured and pricing is fixed or determinable. Generally, this occurs at the time of shipment.
Cost of Goods Sold
The Company classifies the costs of manufacturing and distributing its products as cost of goods sold. Manufacturing costs include variable costs, primarily raw materials and energy, and fixed expenses directly associated with production. Fixed manufacturing costs include, among other things, plant site operating costs and overhead, production planning and logistics, repair and maintenance, plant site purchasing costs, and engineering and technical support costs. Distribution, freight and warehousing costs are also included in cost of goods sold.
Research and Development
Research and development costs are expensed as incurred.
Earnings per Member Equity Unit
Earnings per member equity unit is not presented because it is not considered meaningful information due to the Company's ownership by a single equity holder.
Reclassifications
Certain amounts in the consolidated financial statements for prior periods have been reclassified to conform with the current presentation.
Recently Adopted Financial Accounting Standards
On January 1, 2002, the Company adopted SFAS No. 142, "Goodwill and Other Intangible Assets." SFAS No. 142 changes the accounting for goodwill and intangible assets with indefinite lives from an amortization method to an impairment-only approach. Upon adoption of SFAS No. 142, the Company was required to reassess the useful lives of all acquired intangibles and perform an impairment test on goodwill. In the first quarter of 2002, the Company completed the assessment of useful lives and concluded that no adjustment to the amortization period of intangible assets was necessary.
F-11
The Company has completed its initial assessment of goodwill impairment as of January 1, 2002 and has concluded that there is no indication of impairment. As of December 31, 2003 and 2002, the Company had no goodwill recorded on its consolidated balance sheet.
The initial adoption of SFAS No. 142 had no impact on the Company's financial statements for the year ended December 31, 2002. The pro forma net loss, assuming the change in accounting principle was applied retroactively to January 1, 2001, would not have been materially different for the year ended December 31, 2001.
On January 1, 2002, the Company adopted SFAS No. 144, "Accounting for the Impairment or Disposal of Long-Lived Assets." This statement establishes a single accounting model for the impairment or disposal of long-lived assets. The impact of adopting this pronouncement was not material.
In August 2001, the Financial Accounting Standards Board ("FASB") issued SFAS No. 143, "Accounting for Asset Retirement Obligations." SFAS No. 143 addresses financial accounting and reporting for obligations associated with the retirement of tangible, long-lived assets and the associated asset retirement costs. This statement requires that the fair value of a liability for an asset retirement obligation be recognized in the period in which it is incurred by capitalizing it as part of the carrying amount of the long-lived assets. As required by SFAS No. 143, the Company adopted this new accounting standard on January 1, 2003. The adoption of this statement had no impact since the timing of any ultimate obligation is indefinite.
In April 2002, the FASB issued SFAS No. 145, "Rescission of FASB Statements No. 4, 44 and 64, Amendment of FASB Statement No. 13, and Other Technical Corrections." In addition to amending or rescinding pronouncements to make various technical corrections, clarify meanings or describe applicability, SFAS No. 145 precludes companies from recording gains or losses from extinguishment of debt as an extraordinary item. The Company was required to adopt this statement as of January 1, 2003. The adoption of SFAS No. 145 did not have a material effect on the Company's consolidated financial statements.
In June 2002, the FASB issued SFAS No. 146, "Accounting for Costs Associated With Exit or Disposal Activities." SFAS No. 146 requires recording costs associated with exit or disposal activities at their fair values when a liability has been incurred. Under previous guidance, certain exit costs were accrued upon management's commitment to an exit plan, which is generally before an actual liability has been incurred. The Company adopted this pronouncement in the first quarter of 2003. The adoption of SFAS No. 146 did not have a material effect on the Company's consolidated financial statements.
In January 2003, the FASB issued Financial Interpretation No. ("FIN") 45, "Guarantor's Accounting and Disclosure Requirements for Guarantees, Including Guarantees of Indebtedness of Others." FIN No. 45 requires recognition of a liability for the obligation undertaken upon issuing a guarantee. This liability would be recorded at the inception date of the guarantee and would be measured at fair value. The disclosure provisions of the interpretation are effective for the financial statements as of December 31, 2002. The liability recognition provisions apply prospectively to any guarantees issued or modified after December 31, 2002. The adoption of FIN No. 45 did not have a material effect on the Company's consolidated financial statements.
In May 2003, the FASB issued SFAS No. 149, "Amendment of Statement 133 on Derivative Instruments and Hedging Activities." SFAS No. 149 amends and clarifies accounting for derivative
F-12
instruments and hedging activities under SFAS No. 133. This statement is effective for contracts entered into or modified after June 30, 2003 and for hedging relationships designated after June 30, 2003, with this guidance applied prospectively. The adoption of this statement did not have a material impact on the Company's consolidated financial statements.
In May 2003, the FASB issued SFAS No. 150, "Accounting for Certain Financial Instruments with Characteristics of both Liabilities and Equity." SFAS No. 150 establishes standards for classifying and measuring as liabilities certain financial instruments that embody obligations of the issuer and have characteristics of both liabilities and equity. The adoption of this statement did not have a material impact on the Company's consolidated financial statements.
Recently Issued Financial Accounting Standards
In January 2003, the FASB issued FIN No. 46, "Consolidation of Variable Interest Entities." FIN No. 46 addresses the requirements for business enterprises to consolidate related entities, for which they do not have controlling interests through voting or other rights, if they are determined to be the primary beneficiary as a result of variable economic interests. Transfers to a qualifying special purpose entity are not subject to this interpretation. In December 2003, the FASB issued a complete replacement of FIN No. 46 (FIN No. 46R), which clarified certain complexities and generally requires adoption no later than March 31, 2004 for all entities other than special purpose entities under previous guidance. The Company is currently evaluating the impact of adopting FIN No. 46R.
3. Inventories
Inventories consist of the following (dollars in millions):
| |
December 31, 2003 |
December 31, 2002 |
||||
|---|---|---|---|---|---|---|
| Raw materials and supplies | $ | 180.2 | $ | 149.6 | ||
| Work in progress | 18.0 | 25.9 | ||||
| Finished goods | 398.7 | 385.8 | ||||
| Total | $ | 596.9 | $ | 561.3 | ||
In the normal course of operations, the Company exchanges raw materials with other companies. No gains or losses are recognized on these exchanges, and the net open exchange positions are valued at the Company's cost. The amount deducted from inventory under open exchange agreements owed by the Company at December 31, 2003 was $6.6 million and 18.7 million pounds of feedstock and products, respectively, which represented the amount payable by the Company under open exchange agreements. The Company did not owe any inventory under open exchange agreements at December 31, 2002.
F-13
4. Property, Plant and Equipment
The cost and accumulated depreciation of property, plant and equipment are as follows (dollars in millions):
| |
December 31, 2003 |
December 31, 2002 |
|||||
|---|---|---|---|---|---|---|---|
| Land | $ | 49.4 | $ | 41.2 | |||
| Buildings | 201.0 | 176.5 | |||||
| Plant and equipment | 3,938.9 | 3,428.6 | |||||
| Construction in progress | 156.1 | 173.3 | |||||
| Total | 4,345.4 | 3,819.6 | |||||
| Less accumulated depreciation | (1,089.2 | ) | (748.5 | ) | |||
| Net | $ | 3,256.2 | $ | 3,071.1 | |||
Property, plant and equipment includes gross assets acquired under capital leases of $19.0 million and $20.9 million at December 31, 2003 and 2002, respectively; related amounts included in accumulated depreciation were $5.3 million and $4.3 million at December 31, 2003 and 2002, respectively.
5. Investments in Unconsolidated Affiliates
The Company's ownership percentage and investments in unconsolidated affiliates, primarily manufacturing joint ventures, are as follows (dollars in millions):
| |
December 31, 2003 |
December 31, 2002 |
||||
|---|---|---|---|---|---|---|
| Louisiana Pigment Company, L.P. (50%) | $ | 130.4 | $ | 131.4 | ||
| BASF Huntsman Shanghai Isocyanate Investment BV (50%) | 6.1 | — | ||||
| Rubicon, LLC (50%) | 1.0 | 1.3 | ||||
| Others | 1.2 | 1.2 | ||||
| Total | $ | 138.7 | $ | 133.9 | ||
As noted, the Company owns 50% of BASF Huntsman Shanghai Isocyanate Investment BV. BASF Huntsman Shanghai Isocyanate Investment BV owns a 70% interest in a manufacturing joint venture, thus giving the Company an indirect 35% interest in the manufacturing joint venture.
F-14
Summarized approximate financial information of such affiliated companies as a group as of December 31, 2003 and 2002 and for the years then ended is presented below (dollars in millions):
| |
December 31, 2003 |
December 31, 2002 |
|||||
|---|---|---|---|---|---|---|---|
| Assets | $ | 466.1 | $ | 488.3 | |||
| Liabilities | 189.9 | 222.5 | |||||
| Revenues | 768.0 | 651.3 | |||||
| Net income | 0.2 | 0.4 | |||||
| The Company's equity in: | |||||||
| Net assets | 138.7 | 133.9 | |||||
| Net income | 0.1 | 0.2 | |||||
6. Intangible Assets
The gross carrying amount and accumulated amortization of intangible assets as of December 31, 2003 and 2002 are as follows (dollars in millions):
| |
December 31, 2003 |
December 31, 2002 |
||||||||||||||||
|---|---|---|---|---|---|---|---|---|---|---|---|---|---|---|---|---|---|---|
| |
Carrying Amount |
Accumulated Amortization |
Net |
Carrying Amount |
Accumulated Amortization |
Net |
||||||||||||
| Patents, trademarks, and technology | $ | 389.2 | $ | 116.9 | $ | 272.3 | $ | 377.6 | $ | 93.0 | $ | 284.6 | ||||||
| Non-compete agreements | 49.6 | 38.5 | 11.1 | 49.1 | 30.9 | 18.2 | ||||||||||||
| Total | $ | 438.8 | $ | 155.4 | $ | 283.4 | $ | 426.7 | $ | 123.9 | $ | 302.8 | ||||||
Amortization expense for intangibles for the years ended December 31, 2003, 2002 and 2001 was $32.4, $33.9 million and $33.0 million, respectively. Estimated future amortization expense for intangible assets through December 31, 2008 is as follows (dollars in millions):
| |
Annual Expense |
||
|---|---|---|---|
| 2004 through 2005 | $ | 32.0 | |
| 2006 through 2008 | $ | 24.0 | |
F-15
7. Other Noncurrent Assets
Other noncurrent assets consist of the following (dollars in millions):
| |
December 31, 2003 |
December 31, 2002 |
||||
|---|---|---|---|---|---|---|
| Prepaid pension assets | $ | 235.1 | $ | 233.7 | ||
| Debt issuance costs | 54.4 | 60.7 | ||||
| Capitalized turnaround expense | 52.6 | 47.6 | ||||
| Receivables from affiliates | 13.5 | 18.6 | ||||
| Spare parts inventory | 55.6 | 46.2 | ||||
| Other noncurrent assets | 34.5 | 19.5 | ||||
| Total | $ | 445.1 | $ | 426.3 | ||
8. Accrued Liabilities
Accrued liabilities consist of the following (dollars in millions):
| |
December 31, 2003 |
December 31, 2002 |
||||
|---|---|---|---|---|---|---|
| Payroll, severance and related costs | $ | 77.1 | $ | 67.4 | ||
| Interest | 78.5 | 61.3 | ||||
| Volume and rebates accruals | 64.8 | 52.5 | ||||
| Income tax payable | 35.5 | 17.4 | ||||
| Taxes (property and VAT) | 32.0 | 24.0 | ||||
| Restructuring and plant closing costs | 22.5 | 7.1 | ||||
| Interest and commodity hedging accruals | 10.8 | 22.1 | ||||
| Environmental accruals | 5.7 | 4.3 | ||||
| Other miscellaneous accruals | 60.8 | 42.5 | ||||
| Total | $ | 387.7 | $ | 298.6 | ||
9. Other Noncurrent Liabilities
Other noncurrent liabilities consist of the following (dollars in millions):
| |
December 31, 2003 |
December 31, 2002 |
||||
|---|---|---|---|---|---|---|
| Pension liabilities | $ | 149.0 | $ | 164.5 | ||
| Other postretirement benefits | 11.8 | 10.8 | ||||
| Environmental accruals | 11.6 | 19.3 | ||||
| Payable to affiliate | 29.1 | 37.9 | ||||
| Other noncurrent liabilities | 23.0 | 13.4 | ||||
| Total | $ | 224.5 | $ | 245.9 | ||
F-16
10. Restructuring and Plant Closing Costs
The Company has incurred restructuring and plant closing costs totaling $56.7 million, $7.7 million and $46.6 million for the years ended December 31, 2003, 2002 and 2001, respectively.
2003 Restructuring
In March 2003, our Polyurethanes segment announced that it would integrate its global flexible products unit into its urethane specialties unit, and we recorded a restructuring charge of $19.2 million for workforce reductions of approximately 118 employees. In June 2003, the Polyurethanes segment announced further restructuring at its Rozenburg, Netherlands site, related primarily to workforce reductions of approximately 54 employees. The total estimated costs for the Rozenburg restructuring is estimated to be $12.0 million and will be recorded as expense during 2003 to 2005. During 2003, $7.1 million was recorded as expense for this restructuring. In December 2003, our Polyurethanes segment announced additional restructuring at Polyurethanes sites across the world, related primarily to workforce reductions of approximately 53 employees. The total estimated cost for this restructuring is estimated to be $6.7 million and the remaining amount will be recorded as expense during 2004. During 2003, $1.8 million was recorded as expense for this restructuring. At December 31, 2003, $13.4 million remains in the reserve for restructuring and plant closing costs related to these restructuring activities.
In June 2003, the Company announced that its Performance Products segment would close a number of plants at its Whitehaven, UK facility and reduce its workforce by approximately 85 employees. In 2003, a charge of $20.1 million was recorded representing $11.4 million relating to an impairment of assets at Whitehaven (in connection with the plant shutdowns) and $8.7 million of workforce reduction costs. The Company also recorded a $2.0 million charge in respect of severance costs arising from the closure of an administrative office in London, UK, the rationalization of its surfactants technical center in Oldbury, UK and the restructuring of its Spanish facility in Barcelona, Spain. At December 31, 2003, $2.4 million remains in the reserve for restructuring and plant closing costs related to these restructuring activities. In March 2004, the Company announced an additional restructuring at its Whitehaven, UK facility related to the relocation and consolidation of various plants, equipment and workshop facilities, and the development of a centralized control room to help improve the integrity and productivity of the main site assets. Total restructuring costs associated with this project are expected to be $11.1 million and include an asset write down of approximately $5.0 million and a reduction in workforce of approximately 45 employees. The remaining restructuring costs will be recorded as expense during 2004 to 2007.
In August 2003, the Company announced restructuring activities related to its global workforce reductions of approximately 250 employees in its Pigments segment. The overall cost reduction program for this segment is estimated to be approximately $23.0 million and will be implemented and recorded from 2003 to 2005. During 2003, the Company recorded a restructuring charge of $6.5 million related to workforce reductions of approximately 63 employees across all of its Pigments operations worldwide. At December 31, 2003, $4.3 million remains in the reserve for restructuring and plant closing costs related to these restructuring activities.
2002 Restructuring
In 2002, the Pigments segment recorded $3.1 million in asset write-downs related to the closure of the Company's titanium dioxide manufacturing facility in Greatham, UK.
F-17
During 2002, the Performance Products segment recorded $4.6 million in charges which relate to restructuring and the write-down of fixed assets. The costs relate to the closure of the Alcover, Spain surfactants plant for $1.4 million, write-down of $1.6 million related to the assets of the Castiglione, Italy surfactants plant and various sales offices closed and $1.6 million for other exit costs.
At December 31, 2003, $2.4 million remains in the reserve for restructuring and plant closing costs related to the 2002 restructuring.
2001 Restructuring
During 2001, the Polyurethanes segment announced a cost reduction program which included the closure of the Shepton Mallet, U.K. polyols manufacturing facility by the end of 2002, resulting in a charge of $44.7 million. The program included reductions in workforce of approximately 270 employees at the Shepton Mallet facility and other locations. Approximately $7.8 million was recorded to write-down the fixed assets, $36.1 for employee termination benefits and $0.8 million for other exit costs.
The Pigments segment recorded $1.9 million in restructuring charges related to a workforce reduction of approximately 50 employees.
As of December 31, 2003, all costs related to the 2001 restructuring programs were paid.
As of December 31, 2003, accrued restructuring and plant closing costs consist of the following (dollars in millions):
| |
2001 Charge |
2002 Charge |
2003 Charge |
Non-cash Charge |
Cash Payments |
December 31, 2003 |
||||||||||||
|---|---|---|---|---|---|---|---|---|---|---|---|---|---|---|---|---|---|---|
| Property, plant and equipment | $ | 7.8 | $ | 6.1 | $ | 11.4 | $ | (25.3 | ) | $ | — | $ | — | |||||
| Workforce reductions | 38.0 | — | 45.3 | — | (60.8 | ) | 22.5 | |||||||||||
| Other exit costs | 0.8 | 1.6 | — | — | (2.4 | ) | — | |||||||||||
| Total | $ | 46.6 | $ | 7.7 | $ | 56.7 | $ | (25.3 | ) | $ | (63.2 | ) | $ | 22.5 | ||||
11. Securitization of Accounts Receivable
On December 21, 2000, the Company initiated an accounts receivable securitization program under which it grants an undivided interest in certain of its trade receivables to a qualified off-balance sheet entity (the "Receivables Trust") at a discount. This undivided interest serves as security for the issuance of commercial paper and medium term notes by the Receivables Trust. At December 31, 2003, the Receivables Trust had outstanding approximately $198 million in U.S. dollar equivalents in medium term notes and approximately $100 million in commercial paper. Under the terms of the agreements, the Company and its subsidiaries continue to service the receivables in exchange for a 1% fee of the outstanding receivables, and the Company is subject to recourse provisions.
The Company's retained interest in receivables (including servicing assets) subject to the program was approximately $154 million and $112 million as of December 31, 2003 and 2002, respectively. The value of the retained interest is subject to credit and interest rate risk. For the years ended December 31, 2003 and 2002, new sales totaled approximately $4,132 million and $3,220 million, respectively, and cash collections reinvested totaled approximately $4,136 million and $3,105 million, respectively. Servicing fees received during 2003 and 2002 were approximately $4.9 million and $3.0 million, respectively.
The Company incurs losses on the accounts receivable securitization program for the discount on receivables sold into the program and fees and expenses associated with the program. The Company also retains responsibility for the economic gains and losses on forward contracts mandated by the
F-18
terms of the program to hedge the currency exposures on the collateral supporting the off-balance sheet debt issued. Gains and losses on forward contracts are included as a component of the loss on accounts receivable securitization program are a loss of $24.6 million, a loss of $4.4 million and a gain of $6.1 million for the years ended December 31, 2003, 2002 and 2001, respectively. As of December 31, 2003 and 2002, the fair value of the open forward currency contracts is $6.8 million and $6.1 million which is included as a component of the residual interest.
The key economic assumptions used in valuing the residual interest at December 31, 2003 are presented below:
Weighted average life (in months) |
3 |
|
Credit losses (annual rate) |
Less than 1% |
|
Discount rate (annual rate) |
2% |
A 10% and 20% adverse change in any of the key economic assumptions would not have a material impact on the fair value of the retained interest. Total receivables over 60 days past due as of December 31, 2003 and 2002 were $15.6 million and $11.2 million, respectively.
12. Long-term Debt
Long-term debt outstanding as of December 31, 2003 and 2002 is as follows (dollars in millions):
| |
December 31, 2003 |
December 31, 2002 |
||||||
|---|---|---|---|---|---|---|---|---|
| Senior Secured Credit Facilities: | ||||||||
| Revolving loan facility | $ | 22.0 | $ | 67.0 | ||||
| Term A dollar loan | — | 109.7 | ||||||
| Term A euro loan (in U.S. dollar equivalent) | — | 138.5 | ||||||
| Term B loan | 620.1 | 526.3 | ||||||
| Term C loan | 620.1 | 526.3 | ||||||
| Senior Unsecured Notes | 457.1 | 300.0 | ||||||
| Senior Subordinated Notes | 1,169.8 | 1,076.8 | ||||||
| Other long-term debt | 38.0 | 29.2 | ||||||
| Subtotal | 2,927.1 | 2,773.8 | ||||||
| Less current portion | (1.8 | ) | (43.9 | ) | ||||
| Total | $ | 2,925.3 | $ | 2,729.9 | ||||
HI Credit Facilities
As of December 31, 2003, the Company had senior secured credit facilities (the "HI Credit Facilities") which consisted of a revolving loan facility of up to $400 million that matures on June 30, 2005 (the "HI Revolving Facility"), a term B loan facility that matures on June 30, 2007, and a term C loan facility that matures on June 30, 2008. On October 22, 2003, the Company issued $205 million of additional term B and term C loans, the net proceeds of which were applied to pay down the HI Revolving Facility by approximately $53 million, and the remainder of the net proceeds, net of fees, were applied to repay, in full, the term A loan which had an initial maturity of June 2005. Principal payments on the term B and term C loans begin in 2005.
F-19
Interest rates for the HI Credit Facilities are based upon, at the Company's option, either a eurocurrency rate (LIBOR) or a base rate (prime) plus the applicable spread. The applicable spreads vary based on a pricing grid, in the case of eurocurrency based loans, from 1.50% to 4.50% per annum depending on the loan facility and whether specified conditions have been satisfied, and, in the case of base rate loans, from 0.25% to 3.25% per annum. As of December 31, 2003 and December 31, 2002, the average interest rates on the HI Credit Facilities were 5.6% and 5.8%, respectively, excluding the impact of interest rate hedges.
The Company's obligations under the HI Credit Facilities are supported by guarantees of HIH and the Company's domestic and certain foreign subsidiaries (collectively, the "HI Guarantors"), as well as pledges of substantially all their assets, including 65% of the voting stock of certain non-U.S. subsidiaries.
The HI Credit Facilities contain covenants relating to incurrence of debt, purchase and sale of assets, limitations on investments, affiliate transactions, change in control provisions and maintenance of certain financial ratios. The financial covenants include a leverage ratio, interest coverage ratio, minimum consolidated net worth level and a limit on capital expenditures. The HI Credit Facilities also limit the payment of dividends generally to the amount required by the members to pay income taxes. Management believes that, as of December 31, 2003, HI is in compliance with the covenants of the HI Credit Facilities.
Senior Unsecured Notes and Senior Subordinated Notes
In March 2002, the Company issued $300 million 9.875% Senior Unsecured Notes (collectively with the 2003 Senior Notes, the "Senior Notes"). Interest on the Senior Notes is payable semi-annually and the Senior Notes mature on March 1, 2009. The Senior Notes are fully and unconditionally guaranteed on a joint and several basis by the HI Guarantors. The Senior Notes are redeemable, in whole or in part, at any time by the Company on or prior to March 1, 2006 at 100% of the face value plus a "make whole" premium, as defined in the applicable indenture. After March 1, 2006, the Senior Notes may be redeemed, in whole or in part, at a redemption price that declines from 104.937% to 100% after March 1, 2008.
On April 11, 2003, the Company sold an additional $150 million in aggregate principal amount of 9.875% Senior Notes due 2009 (the "2003 Senior Notes"). The offering was priced at 105.25% plus accrued interest from March 1, 2003. The Company used approximately $26 million of the net proceeds to repay part of the revolving portion of the HI Credit Facilities. The balance of the net proceeds was used primarily to prepay the next 16 months of scheduled amortization due under the term portion of the HI Credit Facilities.
The Company also has outstanding $600 million and €450 million ($569.8 million as of December 31, 2003) 10.125% Senior Subordinated Notes (the "Subordinated Notes"). Interest on the Subordinated Notes is payable semi-annually and the Subordinated Notes mature on July 1, 2009. The Subordinated Notes are fully and unconditionally guaranteed on a joint and several basis by the HI Guarantors. The Subordinated Notes are redeemable, in whole or in part, at any time by the Company prior to July 1, 2004 at 100% of the face value plus a "make whole" premium, as defined in the applicable indenture. On or after July 1, 2004 the Subordinated Notes may be redeemed at 105.063% of the principal amount thereof, declining ratably to par on and after July 1, 2007
The Senior Notes and the Subordinated Notes contain covenants relating to the incurrence of debt, limitations on distributions, asset sales and affiliate transactions, among other things. They also contain a change of control provision requiring the Company to offer to repurchase the Senior Notes
F-20
and the Subordinated Notes upon a change of control. Management believes that the Company is in compliance with the covenants of the Senior Notes and the Subordinated Notes as of December 31, 2003.
Other Debt
Included within other debt is debt associated with the Company's China MDI project. In January 2003, the Company entered into two related joint venture agreements to build MDI production facilities near Shanghai, China. The Company owns 70% (a consolidating interest) of one of the joint ventures with Shanghai Chlor-Alkali Chemical Company, Ltd. (the "Splitting JV").
On September 19, 2003, the Splitting JV obtained secured financing for the construction of the production facilities. The Splitting JV obtained term loans for the construction of its plant in the maximum principal amount of approximately $82.4 million, a working capital credit line in the amount of approximately $35.1 million, and a facility for funding VAT payments in the amount of approximately $0.6 million. As of December 31, 2003, there was $5.0 million in total outstanding debt under the working capital facility. The interest rate on the working capital facility is LIBOR plus 48 basis points, and as of December 31, 2003 was 1.7%. The loans are secured by substantially all the assets of the venture and will be repaid in 16 semi-annual installments, beginning no later than June 30, 2007. The financing is non-recourse to our Company, but will be guaranteed during the construction phase by affiliates of the joint venture, including Huntsman Holdings. Huntsman Holdings unconditionally guarantees 70% of any amounts due and unpaid by the Splitting JV under the loans described above (except for the VAT facility which is not guaranteed). Huntsman Holdings' guarantees remain in effect until the relevant joint venture has (i) commenced production at least 70% of capacity for at least 30 days, and (ii) achieved a debt service cover ratio of at least 1:1.
Included within accounts payable, the Company maintains a $25 million multicurrency overdraft facility for its European subsidiaries (the "European Overdraft Facility"). As of December 31, 2003, the Company had approximately $7.5 million outstanding under the European Overdraft Facility. The European Overdraft Facility is used for daily working capital needs.
Maturities
The scheduled maturities of long-term debt are as follows (dollars in millions):
| |
December 31, 2003 |
||
|---|---|---|---|
| 2004 | $ | 1.8 | |
| 2005 | 43.9 | ||
| 2006 | 14.4 | ||
| 2007 | 616.0 | ||
| 2008 | 604.0 | ||
| Later Years | 1,647.0 | ||
| $ | 2,927.1 | ||
13. Derivative Instruments and Hedging Activities
Interest Rate Hedging
Through the Company's borrowing activities, it is exposed to interest rate risk. Such risk arises due to the structure of the Company's debt portfolio, including the duration of the portfolio and the mix of
F-21
fixed and floating interest rates. The HI Credit Facilities require that a certain portion of debt be at fixed rates through either interest rate hedges or through other means that provide a similar effect. Actions taken to reduce interest rate risk include managing the mix and rate characteristics of various interest bearing liabilities as well as entering into interest rate swaps, collars and options.
As of December 31, 2003 and 2002, the Company had entered into various types of interest rate contracts to manage its interest rate risk on its long-term debt as indicated below (in millions):
| |
December 31, 2003 |
December 31, 2002 |
||||||
|---|---|---|---|---|---|---|---|---|
| Pay fixed swaps | ||||||||
| Notional amount | $ | 212.7 | $ | 202.4 | ||||
| Fair value | $ | (4.9 | ) | $ | (11.8 | ) | ||
| Weighted average pay rate | 5.65 | % | 5.72 | % | ||||
| Maximum weighted average pay rate | 6.60 | % | 6.62 | % | ||||
| Maturing | 2004 | 2004 | ||||||
| Interest rate collars | ||||||||
| Notional amount | $ | 150.0 | $ | 150.0 | ||||
| Fair value | $ | (4.8 | ) | $ | (11.6 | ) | ||
| Weighted average cap rate | 7.00 | % | 7.00 | % | ||||
| Weighted average floor rate | 5.08 | % | 5.08 | % | ||||
| Maximum weighted average floor rate | 6.25 | % | 6.25 | % | ||||
| Maturing | 2004 | 2004 | ||||||
Under interest rate swaps, the Company agrees with other parties to exchange, at specified intervals, the difference between fixed-rate and floating-rate interest amounts calculated by reference to an agreed notional principal amount.
The Company purchases interest rate cap and interest rate collar agreements to reduce the impact of changes in interest rates on its floating-rate long-term debt. The cap agreements entitle the Company to receive from the counterparties (major banks) the amounts, if any, by which the Company's interest payments on certain of its floating-rate borrowings exceed a certain rate. The floor agreements require the Company to pay to the counterparties (major banks) the amount, if any, by which the Company's interest payments on certain of its floating-rate borrowings are less than a certain rate.
The majority of the interest rate contracts have been designated as cash flow hedges of future interest payments on its variable rate debt. The fair value of these interest rate contracts designated as hedges as of December 31, 2003 and 2002 was a loss of approximately $6.2 million and $15.6 million, respectively, which is recorded in other accrued liabilities and in accumulated other comprehensive income (loss) to the extent of the effective portions of the hedging instruments. Gains and losses related to these contracts will be reclassified from other comprehensive income (loss) into earnings in the periods in which the related hedged interest payments are made. As of December 31, 2003, losses of approximately $5.9 million are expected to be reclassified into earnings over the next twelve months. Gains and losses on these agreements, including amounts recorded related to hedge ineffectiveness, are reflected as interest expense in the statement of operations. A net gain of $2.5 million was recorded in interest expense in the year ended December 31, 2003. A net loss of $4.2 million was recorded in interest expense in the year ended December 31, 2002.
As of December 31, 2003 and 2002 swap agreements with a fair value of $3.4 million and $7.8 million loss, respectively have not been designated as a hedge for financial reporting purposes.
F-22
Accordingly, income of $4.6 million and expense of $0.2 million for the years ended December 31, 2003 and 2002 is recognized in interest expense.
The Company is exposed to credit losses in the event of nonperformance by a counterparty to the derivative financial instruments. The Company anticipates, however, that the counterparties will be able to fully satisfy obligations under the contracts. Market risk arises from changes in interest rates.
Commodity Price Hedging
As of December 31, 2003, there were no cash flow commodity price hedging contracts recorded in other current assets and other comprehensive income. As of December 31, 2002, the fair value of cash flow commodity price hedging contracts included in accrued liabilities was $0.8 million.
As of December 31, 2003 commodity price hedging contracts designated as fair value hedges are included in the balance sheet as an increase of $0.8 million to accrued liabilities and an increase in inventory of $0.5 million. As of December 31, 2002 commodity price hedging contracts designated as fair value hedges are included in the balance sheet as an increase of $0.8 to accrued liabilities and an increase to inventory of $0.8 million.
Commodity price contracts not designated as hedges are reflected in the balance sheet as $0.5 million and $0.3 million in other current assets and accrued liabilities, respectively, as of December 31, 2003, and $0.8 million and $0.2 million in other current assets and accrued liabilities, respectively, as of December 31, 2002.
During the years ended December 31, 2003 and 2002, the Company recorded an increase of $2.2 million and $3.5 million, respectively, in cost of goods sold related to net gains and losses from settled contracts, net gains and losses in fair value price hedges, and the change in fair value on commodity price hedging contracts not designated as hedges.
Foreign Currency Rate Hedging
The Company may enter into foreign currency derivative instruments to minimize the short-term impact of movements in foreign currency rates. These contracts are not designated as hedges for financial reporting purposes and are recorded at fair value. As of December 31, 2003 and 2002 and for the year ended December 31, 2003 and 2002, the fair value, change in fair value, and realized gains (losses) of outstanding foreign currency rate hedging contracts was not material.
Net Investment Hedging
Currency effects of net investment hedges produced losses of approximately $93.6 million and $95.9 million in other comprehensive income (loss) (foreign currency translation adjustments) for the years ended December 31, 2003 and 2002, respectively. As of December 31, 2003 and 2002, there was a cumulative net loss of approximately $126.3 million and $32.7 million, respectively.
F-23
14. Income Taxes
The income (loss) before income tax consists of the following (dollars in millions):
| |
Year Ended December 31, 2003 |
Year Ended December 31, 2002 |
Year Ended December 31, 2001 |
|||||||
|---|---|---|---|---|---|---|---|---|---|---|
| U.S. income (loss) | $ | 11.5 | $ | 101.3 | $ | (33.5 | ) | |||
| Foreign loss | (120.8 | ) | (122.8 | ) | (49.7 | ) | ||||
| Total | $ | (109.3 | ) | $ | (21.5 | ) | $ | (83.2 | ) | |
The provision (benefit) for income taxes consists of the following (dollars in millions):
| |
Year Ended December 31, 2003 |
Year Ended December 31, 2002 |
Year Ended December 31, 2001 |
||||||||
|---|---|---|---|---|---|---|---|---|---|---|---|
| U.S.: | |||||||||||
| Current | $ | 0.5 | $ | 1.4 | $ | 0.4 | |||||
| Deferred | — | — | — | ||||||||
| Foreign: | |||||||||||
| Current | 21.1 | 16.9 | 16.7 | ||||||||
| Deferred | — | (59.8 | ) | (43.1 | ) | ||||||
| Total | $ | 21.6 | $ | (41.5 | ) | $ | (26.0 | ) | |||
The following schedule reconciles the differences between the United States federal income taxes at the United States statutory rate to the Company's provision (benefit) for income taxes (dollars in millions):
| |
Year Ended December 31, 2003 |
Year Ended December 31, 2002 |
Year Ended December 31, 2001 |
|||||||
|---|---|---|---|---|---|---|---|---|---|---|
| Income taxes at U.S. federal statutory rate | $ | (38.3 | ) | $ | (7.5 | ) | $ | (29.1 | ) | |
| Income not subject to U.S. federal income tax | (4.0 | ) | (23.1 | ) | 13.0 | |||||
| State income taxes | 0.5 | 0.4 | 0.4 | |||||||
| Foreign country incentive tax benefits | (3.5 | ) | (17.0 | ) | (14.5 | ) | ||||
| Foreign currency exchange gains and losses | (13.0 | ) | 0.8 | 0.3 | ||||||
| Foreign income tax rate in excess of federal statutory rate | 21.9 | 8.8 | 4.4 | |||||||
| Change in valuation allowance | 50.6 | — | — | |||||||
| Expiration and utilization of net operating losses | 7.6 | — | — | |||||||
| Other | (0.2 | ) | (3.9 | ) | (0.5 | ) | ||||
| Total | $ | 21.6 | $ | (41.5 | ) | $ | (26.0 | ) | ||
| Effective income tax rate | (19 | %) | 193 | % | 31 | % | ||||
F-24
The components of deferred tax assets and liabilities are as follows (dollars in millions):
| |
December 31, 2003 |
December 31, 2002 |
|||||||||||
|---|---|---|---|---|---|---|---|---|---|---|---|---|---|
| |
Current |
Long-term |
Current |
Long-term |
|||||||||
| Deferred income tax assets: | |||||||||||||
| Net operating loss carryforwards | $ | — | $ | 266.5 | $ | — | $ | 200.9 | |||||
| Tax basis of plant and equipment in excess of book basis | — | 31.9 | — | 38.9 | |||||||||
| Employee benefits | — | 0.5 | — | 6.1 | |||||||||
| Other accruals and reserves | 14.6 | — | 45.2 | — | |||||||||
| Valuation allowance | — | (64.5 | ) | — | (10.1 | ) | |||||||
| Total | 14.6 | 234.4 | 45.2 | 235.8 | |||||||||
| Deferred income tax liabilities: | |||||||||||||
| Book basis of plant and equipment in excess of tax basis | — | (413.6 | ) | — | (381.4 | ) | |||||||
| Employee benefits | — | (55.6 | ) | — | (69.5 | ) | |||||||
| Other accruals and reserves | (11.6 | ) | — | (14.0 | ) | — | |||||||
| Total | (11.6 | ) | (469.2 | ) | (14.0 | ) | (450.9 | ) | |||||
| Net deferred tax asset (liability) | $ | 3.0 | $ | (234.8 | ) | $ | 31.2 | $ | (215.1 | ) | |||
The Company has net operating loss carryforwards ("NOLs") of approximately $827 million in various foreign jurisdictions. While the majority of the NOLs have no expiration date, $47.2 million have a limited life and begin to expire in 2006. The Company has a valuation allowance against a portion of its deferred tax assets, primarily related to NOLs in certain foreign jurisdictions. If the valuation allowance is reversed, the majority of the benefit will be allocated to the income tax provision on the consolidated statements of operations, while $3.2 million of the benefit will be used to reduce intangible assets. During 2003, the company recorded an additional valuation allowance of $54.4 million. During 2002, the Company reversed a valuation allowance of $19.1 million, of which $17.5 million was used to reduce goodwill and other intangibles.
The Company does not provide for income taxes or benefits on the undistributed earnings of its international subsidiaries as earnings are reinvested and, in the opinion of management, will continue to be reinvested indefinitely. In consideration of the Company's corporate structure, upon distribution of these earnings, certain of the Company's subsidiaries would be subject to both income taxes and withholding taxes in the various international jurisdictions. It is not practicable to estimate the amount of taxes that might be payable upon distribution.
The Company is treated as a partnership for U.S. federal income tax purposes and as such is generally not subject to U.S. income tax, but rather such income is taxed directly to the Company's owners. Pursuant to the limited liability company agreement and the limited liability company agreement of HIH, the Company has a tax sharing arrangement with all of the Company's and HIH's membership interest holders. Under the arrangement, because the Company is treated as a partnership for United States income tax purposes, the Company will make payments to its parent, HIH, which will in turn make payments to its membership interest holders, in an amount equal to the United States federal and state income taxes we and HIH would have paid had HIH been treated as a corporation for tax purposes. The arrangement also provides that, if we had previously made payments to HIH, and HIH had made payments out to its membership interest holders, the Company will receive cash payments back from the membership interest holders (through HIH) in amounts equal to the United States federal and state income tax refunds or benefit against future tax liabilities we would have received from the use of net operating losses or tax credits generated by the Company, up to the
F-25
amount of payments that we had previously made. As of December 31, 2003, approximately $3.9 million is due from the membership interest holders (through HIH). The net difference of the book basis of the U.S. assets and liabilities over the tax basis of those assets and liabilities is approximately $478 million.
15. Other Comprehensive Income (Loss)
The components of other comprehensive income (loss) are as follows (dollars in millions):
| |
December 31, 2003 |
December 31, 2002 |
December 31, 2001 |
||||||||||||||||
|---|---|---|---|---|---|---|---|---|---|---|---|---|---|---|---|---|---|---|---|
| |
Accumulated other comprehensive income (loss) |
Other comprehensive income (loss) |
Accumulated other comprehensive income (loss) |
Other comprehensive income (loss) |
Accumulated other comprehensive income (loss) |
Other comprehensive income (loss) |
|||||||||||||
| Foreign currency translation adjustments | $ | 160.5 | $ | 198.1 | $ | (37.6 | ) | $ | 148.1 | $ | (185.7 | ) | $ | (65.0 | ) | ||||
| Additional minimum pension liability, net of tax of $29.6 million and $37.7 million as of December 31, 2003 and 2002 respectively. | (77.1 | ) | 11.0 | (88.1 | ) | (88.1 | ) | — | — | ||||||||||
| Additional minimum pension liability—unconsolidated affiliate | (5.6 | ) | (0.2 | ) | (5.4 | ) | (5.4 | ) | — | — | |||||||||
| Unrealized gain (loss) on securities | 0.2 | 3.8 | (3.6 | ) | (3.6 | ) | — | — | |||||||||||
| Net unrealized gain (loss) on derivative instruments | (4.9 | ) | 6.7 | (11.6 | ) | 2.4 | (14.0 | ) | (14.0 | ) | |||||||||
| Cumulative effect of accounting change | (1.1 | ) | — | (1.1 | ) | — | (1.1 | ) | (1.1 | ) | |||||||||
| Total | $ | 72.0 | $ | 219.4 | $ | (147.4 | ) | $ | 53.4 | $ | (200.8 | ) | $ | (80.1 | ) | ||||
16. Employee Benefit Plans
Defined Benefit and Other Postretirement Benefit Plans
The Company sponsors various contributory and non-contributory defined benefit pension plans covering employees in the U.S., the U.K., Netherlands, Belgium, Canada and a number of other countries. The Company funds the material plans through trust arrangements (or local equivalents) where the assets of the fund are held separately from the employer. The level of funding is in line with local practice and in accordance with the local tax and supervisory requirements. The plan assets consist primarily of equity and fixed income securities.
The Company also sponsors unfunded post-retirement benefit plans other than pensions which provide medical and life insurance benefits covering certain employees in the U.S. and Canada. In 2003, the healthcare trend rate used to measure the expected increase in the cost of benefits was assumed to be 10% per annum decreasing to 5% per annum after four years. In 2002, the healthcare
F-26
trend rate used to measure the expected increase in the cost of benefits was assumed to be 11% per annum decreasing to 5.0% per annum after five years.
If the healthcare cost trend rate assumptions were increased by 1%, the postretirement benefit obligation as of December 31, 2003 would be increased by $1.4 million. The effect of this change on the sum of the service cost and interest cost would be an increase of $0.1 million. If the healthcare cost trend rate assumptions were decreased by 1%, the postretirement benefit obligation as of December 31, 2003 would be decreased by $1.2 million. The effect of this change on the sum of the service cost and interest cost would be a decrease of $0.1 million.
F-27
The following table sets forth the funded status of the plans and the amounts recognized in the consolidated balance sheets at December 31, 2003 and 2002 (dollars in millions):
| |
Defined Benefit Plans |
Other Postretirement Benefit Plans |
|||||||||||||
|---|---|---|---|---|---|---|---|---|---|---|---|---|---|---|---|
| |
2003 |
2002 |
2003 |
2002 |
|||||||||||
| Change in benefit obligation | |||||||||||||||
| Benefit obligation at beginning of year | $ | 1,144.4 | $ | 959.0 | $ | 11.6 | $ | 10.3 | |||||||
| Service cost | 36.9 | 34.1 | 0.4 | 0.4 | |||||||||||
| Interest cost | 64.2 | 56.4 | 0.8 | 0.7 | |||||||||||
| Participant contributions | 2.4 | 2.4 | — | — | |||||||||||
| Plan amendments | 0.3 | 4.3 | (1.4 | ) | — | ||||||||||
| Exchange rate changes | 162.6 | 124.3 | 0.7 | — | |||||||||||
| Settlements/transfers | — | — | — | — | |||||||||||
| Other | 3.9 | 4.2 | — | — | |||||||||||
| Curtailments | (1.9 | ) | — | — | — | ||||||||||
| Special termination benefits | 9.8 | — | — | — | |||||||||||
| Actuarial (gain)/loss | 45.2 | 1.8 | 2.3 | 0.8 | |||||||||||
| Benefits paid | (43.3 | ) | (42.1 | ) | (0.7 | ) | (0.6 | ) | |||||||
| Benefit obligation at end of year | $ | 1,424.5 | $ | 1,144.4 | $ | 13.7 | $ | 11.6 | |||||||
| Change in plan assets | |||||||||||||||
| Fair value of plan assets at beginning of year | $ | 907.9 | $ | 930.8 | $ | — | $ | — | |||||||
| Actual return on plan assets | 129.6 | (129.3 | ) | — | |||||||||||
| Exchange rate changes | 139.6 | 110.3 | — | — | |||||||||||
| Plan amendments | — | — | — | — | |||||||||||
| Participant contributions | 2.4 | 2.4 | — | — | |||||||||||
| Other | 2.3 | 0.6 | — | — | |||||||||||
| Administrative expenses | — | — | — | — | |||||||||||
| Company contributions | 38.3 | 34.4 | 0.7 | — | |||||||||||
| Acquisitions | — | 0.5 | |||||||||||||
| Benefits paid | (43.3 | ) | (41.8 | ) | (0.7 | ) | — | ||||||||
| Fair value of plan assets at end of year | $ | 1,176.8 | $ | 907.9 | $ | — | $ | — | |||||||
| Funded status | |||||||||||||||
| Funded status | $ | (247.7 | ) | $ | (236.5 | ) | $ | (13.7 | ) | $ | (11.6 | ) | |||
| Unrecognized net actuarial (gain)/loss | 439.3 | 427.1 | 4.7 | 2.4 | |||||||||||
| Unrecognized prior service cost | 6.4 | 5.8 | (2.8 | ) | (1.6 | ) | |||||||||
| Unrecognized net transition obligation | — | — | — | 0.4 | |||||||||||
| Accrued benefit cost | $ | 198.0 | $ | 196.4 | $ | (11.8 | ) | $ | (10.4 | ) | |||||
| Amounts recognized in balance sheet: | |||||||||||||||
| Accrued benefit cost recognized in accrued liabilities and other noncurrent liabilities | $ | (149.0 | ) | $ | (164.5 | ) | $ | (11.8 | ) | $ | (10.4 | ) | |||
| Prepaid pension cost | 235.1 | 233.7 | — | — | |||||||||||
| Intangible asset | 5.2 | 4.4 | — | — | |||||||||||
| Accumulated other comprehensive income | 106.7 | 122.8 | — | — | |||||||||||
| Accrued benefit cost | $ | 198.0 | $ | 196.4 | $ | (11.8 | ) | $ | (10.4 | ) | |||||
F-28
Components of the net periodic benefit costs for the years ended December 31, 2003, 2002 and 2001 are as follows (dollars in millions):
| |
Defined Benefit Plans |
Other Postretirement Benefit Plans |
|||||||||||||||||
|---|---|---|---|---|---|---|---|---|---|---|---|---|---|---|---|---|---|---|---|
| |
2003 |
2002 |
2001 |
2003 |
2002 |
2001 |
|||||||||||||
| Service cost | $ | 36.9 | $ | 28.9 | $ | 34.0 | $ | 0.4 | $ | 0.4 | $ | 0.3 | |||||||
| Interest cost | 64.2 | 52.3 | 56.4 | 0.8 | 0.7 | 0.6 | |||||||||||||
| Expected return on assets | (66.5 | ) | (73.4 | ) | (67.5 | ) | 0.0 | 0.0 | 0.0 | ||||||||||
| Amortization of transition obligation | — | — | — | — | — | — | |||||||||||||
| Amortization of prior service cost | 0.6 | 0.3 | 4.4 | (0.2 | ) | (0.2 | ) | (0.1 | ) | ||||||||||
| Amortization of actuarial (gain)/loss | 22.9 | (0.2 | ) | 7.5 | 0.2 | 0.1 | 0.3 | ||||||||||||
| Net periodic benefit cost | $ | 58.1 | $ | 7.9 | $ | 34.8 | $ | 1.2 | $ | 1.0 | $ | 1.1 | |||||||
The following assumptions were used in the above calculations:
| |
Defined Benefit Plans |
Other Postretirement Benefit Plans |
||||||||||||
|---|---|---|---|---|---|---|---|---|---|---|---|---|---|---|
| |
2003 |
2002 |
2001 |
2003 |
2002 |
2001 |
||||||||
| Weighted-average assumptions as of December 31: | ||||||||||||||
| Discount rate | 5.51 | % | 5.51 | % | 5.74 | % | 6.25 | % | 6.62 | % | 7.03 | % | ||
| Expected return on plan assets | 7.29 | % | 7.00 | % | 7.05 | % | N/A | N/A | N/A | |||||
| Rate of compensation increase | 3.76 | % | 3.39 | % | 3.46 | % | 4.00 | % | 4.00 | % | 4.00 | % | ||
F-29
The projected benefit obligation, accumulated benefit obligation, and fair value of plan assets for the defined benefit plans with accumulated benefit obligations in excess of plan assets were as follows (dollars in millions):
| |
2003 |
2002 |
||||
|---|---|---|---|---|---|---|
| Projected benefit obligation | $ | 1,424.5 | $ | 765.4 | ||
| Accumulated benefit obligation | 1,172.1 | 616.3 | ||||
| Fair value of plan assets | 1,176.8 | 544.8 | ||||
Equity securities in the Company's U.S. pension plan did not include any equity securities of the Company or its affiliates at the end of 2003.
Defined Contribution Plans
The Company has defined contribution plans covering its domestic employees and employees in some foreign subsidiaries who have completed at least two years of service.
The Company's total combined expense for the above defined contribution plans for the years ended December 31, 2003, 2002 and 2001 were approximately $6.9 million, $6.1 million and $6.3 million, respectively.
17. Commitments and Contingencies
The Company has various purchase commitments extending through 2017 for materials, supplies and services entered into in the ordinary course of business. The purchase commitments are contracts that require minimum volume purchases. Certain contracts allow for changes in minimum required purchase volumes in the event of a temporary or permanent shut down of a facility. The contractual purchase price for substantially all of these contracts is variable based upon market prices, subject to annual negotiations. The Company has also entered into a limited number of contracts which require minimum payments, even if no volume is purchased. These contracts approximate $35 million annually through 2005, declining to approximately $16 million after 2011. Historically, the Company has not made any minimum payments under its take or pay contracts.
The Company is a party to various proceedings instituted by private plaintiffs, governmental authorities and others arising under provisions of applicable laws, including various environmental, products liability and other laws. Based in part on the indemnities provided to the Company by ICI and Huntsman Specialty Chemicals Corporation ("Huntsman Specialty") in connection with the transfer of business to the Company and insurance coverage, management does not believe that the outcome of any of these matters will have a material adverse effect on the Company's financial condition or results of operations.
18. Environmental Matters
General
The Company's operations are subject to extensive environmental laws and regulations concerning emissions to the air, discharges to surface and subsurface waters, and the generation, handling, storage, transportation, treatment and disposal of waste materials, as adopted by various governmental authorities in the jurisdictions in which it operates. The Company makes every reasonable effort to remain in full compliance with existing governmental regulations. Accordingly, the Company may incur costs for capital improvements and general compliance under environmental laws, including costs to acquire, maintain and repair pollution control equipment. The Company cannot provide assurances that material capital expenditures beyond those currently anticipated will not be required under environmental laws.
F-30
Environmental Accruals
The Company has established financial reserves relating to environmental restoration and remediation programs, which it believes are sufficient for known requirements. In connection with various acquisitions, the acquisition agreements generally provide for indemnification for environmental pollution existing on the date of acquisition. Liabilities are recorded when site restoration and environmental remediation and clean-up obligations are either known or considered probable and can be reasonably estimated. Liabilities are based upon all available facts, existing technology, past experience and cost-sharing and indemnification arrangements (as to which, the Company considers the viability of other parties).
The Company's capital expenditures relating to environmental matters for the year ended December 31, 2003, were approximately $31 million. A total of $17.0 million has been accrued related to environmental related liabilities as of December 31, 2003.
Estimates of ultimate future environmental restoration and remediation costs are inherently imprecise due to currently unknown factors such as the magnitude of possible contamination, the timing and extent of such restoration and remediation, the determination of the Company's liability in proportion to other parties, the extent to which such costs are recoverable from insurance, and the extent to which environmental laws and regulations may change in the future. However, it is not anticipated that any future costs, in excess of those that have been accrued by the Company, will be material to its results of operations or financial position as a result of compliance with current environmental laws and regulations.
Potential Liabilities
Given the nature of the Company's business, violations of environmental laws may result in restrictions being imposed on operating activities, substantial fines, penalties, damages or other costs, any of which could have a material adverse effect on the Company's business, financial condition, results of operations or cash flows. The Company is aware of the following matters:
The Texas Commission on Environmental Quality (the "TCEQ," formerly the Texas Natural Resource Conservation Commission or TNRCC) approved a settlement with Huntsman Petrochemical Corporation effective June 12, 2003 regarding allegations of environmental regulatory violations at the Company's Port Neches, Texas, facilities. The settlement imposes penalties totaling $302,250, of which $7,000 has already been paid. The balance of the penalty is due on June 11, 2005. Additionally, the settlement requires that the Company apply for an air emissions permit for the joint wastewater treatment plant that services all of the Port Neches facilities. Less than $100,000 of the aforementioned penalties are allocable to the Company. Although management does not anticipate it, it is possible that the terms of a joint wastewater treatment plant air permit may cause the Company to incur substantial costs that could be material.
On October 6, 2002, a leak of sulphuric acid from two tanks located near the Company's Whitehaven, U.K. plant was discovered. About 342 to 347 tonnes of acid were released onto the ground and into the soil near the tanks. Although the Company took immediate steps to contain the spillage and recover acid, a quantity of acid reached a nearby beach via a geological fault. The Company believes that it did not own the tanks; however, it did own the acid in the tanks. The U.K. Environment Agency ("EA") is conducting an investigation that could result in a prosecution being initiated. The U.K. Health and Safety Executive has issued three Improvement Notices requiring corrective action with which the Company is complying. Although the Company can give no assurances, based on currently available information and its understanding of similar investigations and penalties in
F-31
the past, it believes that, if any charges are brought or additional corrective action orders issued and the Company is ultimately found to be legally responsible, the probable penalties would not be material to its financial position or results of operations.
During 2002 and 2003, the Company voluntarily removed filter salts from a property previously operated by Almagrera in Spain. Almagrera supplied sulphuric acid to one of the Company's subsidiaries. Under an agreement with Almagrera, the subsidiary had for some time supplied filter salts to Almagrera to be used in the manufacture of sulphuric acid. When Almagrera filed for bankruptcy and closed its plant in 2001, a large quantity of stored filter salts was found on its premises, far from its normal warehouse. The Company spent $2.2 million to remove and dispose of the salts. The project has been completed.
The Company is aware that there is or may be soil or groundwater contamination at some of its facilities resulting from past operations. Based on available information and the indemnification rights (including indemnities provided by Huntsman Specialty, ICI, The Rohm and Haas Company, Rhodia S.A. and Dow Chemical, for the facilities that each of them transferred to the Company), the Company believes that the costs to investigate and remediate known contamination will not have a material adverse effect on its financial condition, results of operations or cash flows; however, the Company cannot give any assurance that such indemnities will fully cover the costs of investigation and remediation, that it will not be required to contribute to such costs or that such costs will not be material.
By a Notice of Enforcement letter dated March 6, 2003, the Company was notified by the TCEQ of a probable enforcement action arising out of the inspection of the Freeport, Texas facility on December 16-19, 2002. Seven types of violations relating to the Texas Clean Air Act requirements were cited. After extensive communications with the TCEQ regarding the validity of the allegations, the TCEQ determined that the imposition of penalties was inappropriate. This matter has been dropped.
Under the EU Integrated Pollution Prevention and Control Directive ("IPPC"), EU member governments are to adopt rules and implement a cross-media (air, water, waste) environmental permitting program for individual facilities. The UK was the first EU member government to request IPPC permit applications from the Company. In the UK, the Company has submitted several applications and, very recently, negotiated and received its first IPPC permits. Based upon the terms of these permits, the Company does not anticipate that it will have to make material capital expenditures to comply. Other IPPC permits are under review by the UK Environment Agency. The Company is not yet in a position to know with certainty what the other UK IPPC permits will require, and it is possible that the costs of compliance could be material; however, the Company believes, based upon its experience to date, that the costs of compliance with IPPC permitting in the UK will not be material to its financial condition or results of operations. Additionally, the IPPC directive has recently been implemented in France, and like the Company's operations in the UK, the Company does not anticipate having to make material capital expenditures to comply.
With respect to the Company's facilities in other EU jurisdictions, IPPC implementing legislation is not yet in effect, or the Company has not yet been required to seek IPPC permits. Accordingly, while the Company expects to incur additional future costs for capital improvements and general compliance under IPPC requirements in these jurisdictions, at the present time it is unable to determine whether or not these costs will be material. Accordingly, the Company cannot provide assurance that material capital expenditures and compliance costs will not be required in connection with IPPC requirements.
F-32
MTBE Developments
The use of MTBE is controversial in the United States and elsewhere and may be substantially curtailed or eliminated in the future by legislation or regulatory action. The presence of MTBE in some groundwater supplies in California and other states (primarily due to gasoline leaking from underground storage tanks) and in surface water (primarily from recreational watercraft) has led to public concern about MTBE's potential to contaminate drinking water supplies. Heightened public awareness regarding this issue has resulted in state, federal and foreign initiatives to rescind the federal oxygenate requirements for reformulated gasoline or restrict or prohibit the use of MTBE in particular. For example, the California Air Resources Board adopted regulations that prohibit the addition of MTBE to gasoline as of January 1, 2004. Certain other states have also taken actions to restrict or eliminate the future use of MTBE. In connection with its ban, the State of California requested that the EPA waive the federal oxygenated fuels requirements of the federal Clean Air Act for gasoline sold in California. The EPA denied the State's request on June 12, 2001. Certain of the state bans, including California's ban, have been challenged in court as unconstitutional (in light of the Clean Air Act). On June 4, 2003, a federal court of appeals rejected such a challenge to California's ban, ruling that the ban is not pre-empted by the Clean Air Act.
Bills have been introduced in the U.S. Congress to curtail or eliminate the oxygenated fuels requirements in the Clean Air Act, or curtail MTBE use. To date, no such legislation has become law, but such legislation is being considered by Congress and could result in a federal ban on the use of MTBE in gasoline. In addition, on March 20, 2000, the EPA announced its intention, through an advanced notice of proposed rulemaking, to phase out the use of MTBE under authority of the federal Toxic Substances Control Act. In its notice, the EPA also called on the U.S. Congress to restrict the use of MTBE under the Clean Air Act.
In Europe, the EU issued a final risk assessment report on MTBE on September 20, 2002. While no ban of MTBE was recommended, several risk reduction measures relating to storage and handling of MTBE-containing fuel were recommended. Separate from EU action, Denmark entered into a voluntary agreement with refiners to reduce the sale of MTBE in Denmark. Under the agreement, use of MTBE in 92- and 95-octane gasoline in Denmark ceased by May 1, 2002; however, MTBE is still an additive in a limited amount of 98-octane gasoline sold in about 100 selected service stations in Denmark.
Any phase-out or other future regulation of MTBE in other states, nationally or internationally may result in a significant reduction in demand for the Company's MTBE and result in a material loss in revenues or material costs or expenditures. In the event that there should be a phase-out of MTBE in the United States, the Company believes it will be able to export MTBE to Europe or elsewhere or use its co-product TBA to produce saleable products other than MTBE. The Company believes that the low production costs at its PO/MTBE facility will put it in a favorable position relative to other higher cost sources (primarily, on-purpose manufacturing). If the Company opts to produce products other than MTBE, necessary modifications to its facilities may require significant capital expenditures and the sale of the other products may produce a materially lower level of cash flow than the sale of MTBE.
In addition, while the Company has not been named as a defendant in any litigation concerning the environmental effects of MTBE, it cannot provide assurances that it will not be involved in any such litigation or that such litigation will not have a material adverse effect on its business, financial condition, results of operations or cash flows. In 2003, the U.S. House of Representatives passed a version of an energy bill that contained limited liability protection for producers of MTBE. The Senate's version of the bill did not have liability protection. The issue was one of the reasons that a
F-33
compromise energy bill was not passed. Whether a compromise will be reached on this legislation in 2004, and whether any compromise will provide liability protection for producers, are unknown. In any event, the liability protection provision in the House bill applied only to defective product claims; it would not preclude other types of lawsuits.
REACH Developments
On October 29, 2003, the European Commission adopted a proposal for a new EU regulatory framework for chemicals. Under this proposed new system called "REACH" (Registration, Evaluation and Authorisation of CHemicals), enterprises that manufacture or import more than one ton of a chemical substance per year would be required to register such manufacture or import in a central database. The REACH initiative, as proposed, would require risk assessment of chemicals, preparations (e.g., soaps and paints) and articles (e.g., consumer products) before those materials could be manufactured or imported into EU countries. Where warranted by a risk assessment, hazardous substances would require authorizations for their use. This regulation could impose risk control strategies that would require capital expenditures by the Company. As proposed, REACH would take effect in stages over the next decade. The impacts of REACH on the chemical industry and on the Company are unclear at this time because the parameters of the program are still being actively debated. Nevertheless, it is possible that REACH, if implemented, would be costly to the Company.
19. Related-party Transactions
The Company shares numerous services and resources with Huntsman LLC and its subsidiaries. In accordance with various agreements, Huntsman LLC provides management, operating, maintenance, steam, electricity, water and other services to the Company. The Company also relies on Huntsman LLC to supply certain raw materials and to purchase products. Rubicon, LLC, and Louisiana Pigment Company are unconsolidated 50% owned affiliates of the Company. The amounts which the Company purchased from or sold to related parties are as follows (dollars in millions):
| |
Year Ended December 31, 2003 |
Year Ended December 31, 2002 |
Year Ended December 31, 2001 |
|||||||||||||||
|---|---|---|---|---|---|---|---|---|---|---|---|---|---|---|---|---|---|---|
| |
Purchases From |
Sales To |
Purchases From |
Sales To |
Purchases From |
Sales To |
||||||||||||
| Huntsman LLC and subsidiaries | $ | 200.9 | $ | 72.4 | $ | 226.6 | $ | 57.7 | $ | 217.5 | $ | 73.8 | ||||||
| ICI and subsidiaries(1) | 6.7 | 107.5 | 188.6 | 252.6 | 235.5 | 286.2 | ||||||||||||
| Other unconsolidated affiliates | 392.7 | 23.9 | 392.7 | 23.4 | 537.5 | 16.0 | ||||||||||||
Included in purchases from Huntsman LLC and its subsidiaries for the years ended December 31, 2003, 2002 and 2001 is $74 million, $65 million and $54 million, respectively, of allocated management
F-34
costs which are reported in selling, general and administrative expenses. The amounts which the Company is owed or owes to related parties are as follows (dollars in millions):
| |
December 31, 2003 |
December 31, 2002 |
||||||||||||||||||||||
|---|---|---|---|---|---|---|---|---|---|---|---|---|---|---|---|---|---|---|---|---|---|---|---|---|
| |
Receivables From |
Payables To |
Receivables From |
Payables To |
||||||||||||||||||||
| |
Current |
Non- current |
Current |
Non- current |
Current |
Non- current |
Current |
Non- current |
||||||||||||||||
| Huntsman LLC and subsidiaries | $ | 15.6 | $ | — | $ | 52.5 | $ | — | $ | 16.3 | $ | — | $ | 47.1 | $ | — | ||||||||
| ICI and subsidiaries(1) | N/A | N/A | N/A | N/A | 39.9 | 5.8 | 6.3 | — | ||||||||||||||||
| Other unconsolidated affiliates | 10.3 | 13.5 | 25.2 | 29.1 | 9.0 | 12.8 | 29.5 | 37.9 | ||||||||||||||||
20. Lease Commitments
The Company leases a number of assets which are accounted for as operating leases. The lease obligation reflected in the Company's consolidated statements of operations as rental expense, totaled $11.0 million, $15.8 million and $18.5 million for the years ended December 31, 2003, 2002 and 2001, respectively. The minimum future rental payments due under existing agreements are by year (dollars in millions):
| Year |
Amount |
||
|---|---|---|---|
| 2004 | $ | 15.2 | |
| 2005 | 13.2 | ||
| 2006 | 7.8 | ||
| 2007 | 7.0 | ||
| 2008 | 3.9 | ||
| Later years | 44.2 | ||
The Company also has lease obligations accounted for as capital leases which are included in other long term debt. The present value of the future net minimum lease payments is $12.3 million and $18.3 million at December 31, 2003 and 2002, respectively.
21. Industry Segment and Geographic Area Information
The Company derives its revenues, earnings and cash flows from the manufacture and sale of a wide variety of specialty and commodity chemical products. The Company has four reportable operating segments: Polyurethanes, Performance Products, Pigments and Base Chemicals. During 2002 the Company realigned its principal operating segments. The most significant change was the split of the former Specialty Chemicals segment into two segments: Polyurethanes and Performance Products. The former Tioxide segment was renamed Pigments and the former Petrochemicals segment was renamed Base Chemicals.
The major products of each reportable operating segment are as follows:
| Segment |
Products |
|
|---|---|---|
| Polyurethanes | MDI, TDI, TPU, polyols, aniline, PO, TBA and MTBE | |
| Performance Products | Surfactants, ethyleneamines and other performance chemicals | |
| Pigments | Titanium dioxide | |
| Base Chemicals | Ethylene, propylene, benzene, cyclohexane and paraxylene |
F-35
Financial information for each of the Company's reportable operating segments is as follows (dollars in millions):
| |
Year Ended December 31, 2003 |
Year Ended December 31, 2002 |
Year Ended December 31, 2001 |
|||||||||
|---|---|---|---|---|---|---|---|---|---|---|---|---|
| Net Revenues: | ||||||||||||
| Polyurethanes | $ | 2,297.5 | $ | 2,066.0 | $ | 2,073.7 | ||||||
| Performance Products | 659.6 | 574.3 | 455.3 | |||||||||
| Pigments | 1,009.9 | 880.3 | 872.1 | |||||||||
| Base Chemicals | 1,421.8 | 1,097.5 | 1,268.6 | |||||||||
| Eliminations | (143.3 | ) | (100.0 | ) | (94.5 | ) | ||||||
| Total | $ | 5,245.5 | $ | 4,518.1 | $ | 4,575.2 | ||||||
| EBITDA(1): | ||||||||||||
| Polyurethanes | $ | 233.4 | $ | 365.1 | $ | 262.7 | ||||||
| Performance Products | (15.8 | ) | 27.2 | 21.1 | ||||||||
| Pigments | 105.4 | 68.3 | 139.4 | |||||||||
| Base Chemicals | 77.7 | 13.8 | 20.4 | |||||||||
| Corporate and other items(2) | 19.4 | 5.8 | (60.4 | ) | ||||||||
| Total EBITDA | $ | 420.1 | $ | 480.2 | $ | 383.2 | ||||||
| Interest expense, net | (251.5 | ) | (245.4 | ) | (239.6 | ) | ||||||
| Income tax benefit (expense) | (21.6 | ) | 41.5 | 26.0 | ||||||||
| Cumulative effect of accounting change | — | — | (1.5 | ) | ||||||||
| Depreciation and amortization | (277.9 | ) | (256.2 | ) | (229.0 | ) | ||||||
| Net income (loss) | $ | (130.9 | ) | $ | 20.1 | $ | (60.9 | ) | ||||
| Depreciation and Amortization: | ||||||||||||
| Polyurethanes | $ | 142.6 | $ | 134.7 | $ | 130.1 | ||||||
| Performance Products | 12.7 | 10.6 | 4.6 | |||||||||
| Pigments | 65.2 | 54.2 | 43.8 | |||||||||
| Base Chemicals | 49.9 | 47.3 | 43.4 | |||||||||
| Corporate and other items(2) | 7.5 | 9.4 | 7.1 | |||||||||
| Total | $ | 277.9 | $ | 256.2 | $ | 229.0 | ||||||
| Capital Expenditures: | ||||||||||||
| Polyurethanes | $ | 39.1 | $ | 58.3 | $ | 77.6 | ||||||
| Performance Products | 12.2 | 11.5 | 5.9 | |||||||||
| Pigments | 51.7 | 97.4 | 161.4 | |||||||||
| Base Chemicals | 24.4 | 23.3 | 29.3 | |||||||||
| Corporate and other items | — | — | 16.8 | |||||||||
| Total | $ | 127.4 | $ | 190.5 | $ | 291.0 | ||||||
| Total Assets: | ||||||||||||
| Polyurethanes | $ | 3,733.9 | $ | 3,489.4 | $ | 3,217.4 | ||||||
| Performance Products | 307.6 | 307.7 | 316.2 | |||||||||
| Pigments | 1,554.5 | 1,502.8 | 1,386.6 | |||||||||
| Base Chemicals | 1,168.2 | 1,052.6 | 939.3 | |||||||||
| Corporate and other items(2) | 3,585.8 | 3,372.7 | 3,281.7 | |||||||||
| Eliminations | (4,857.3 | ) | (4,557.9 | ) | (4,279.1 | ) | ||||||
| Total | $ | 5,492.7 | $ | 5,167.3 | $ | 4,862.1 | ||||||
F-36
| |
Year Ended December 31, 2003 |
Year Ended December 31, 2002 |
Year Ended December 31, 2001 |
|||||||||
|---|---|---|---|---|---|---|---|---|---|---|---|---|
| |
(In millions) |
|||||||||||
| By Geographic Area | ||||||||||||
Net Sales: |
||||||||||||
| United States | $ | 1,853.1 | $ | 1,742.4 | $ | 1,573.1 | ||||||
| United Kingdom | 1,927.0 | 1,537.9 | 1,628.5 | |||||||||
| Netherlands | 1,019.8 | 894.6 | 929.8 | |||||||||
| Other nations | 1,640.6 | 1,457.6 | 1,344.5 | |||||||||
| Adjustments and eliminations | (1,195.0 | ) | (1,114.4 | ) | (900.7 | ) | ||||||
| Total | $ | 5,245.5 | $ | 4,518.1 | $ | 4,575.2 | ||||||
| Long-lived Assets: | ||||||||||||
| United States | $ | 858.0 | $ | 901.6 | $ | 950.1 | ||||||
| United Kingdom | 1,133.5 | 1,077.8 | 976.4 | |||||||||
| Netherlands | 410.6 | 366.7 | 304.8 | |||||||||
| Other nations | 854.1 | 725.0 | 608.2 | |||||||||
| Corporate | 0.0 | 0.0 | ||||||||||
| Total | $ | 3,256.2 | $ | 3,071.1 | $ | 2,839.5 | ||||||
22. Selected Unaudited Quarterly Financial Data
In March 2004, the Company's management discovered that it had inappropriately calculated foreign exchange gains and losses with respect to its accounts receivable securitization program and had incorrectly classified the foreign exchange gains and losses on the securitized receivables denominated in foreign currency in its consolidated statements of operations for each of the first three quarters of 2003. As a result, the Company has restated its consolidated financial statements for each of the first three quarters of 2003 to correct its accounting and classification of foreign exchange gains and losses related to the accounts receivable securitization program. A summary of the significant effects of this restatement is included below (dollars in millions):
| |
Three Months Ended March 31, 2003 |
Three Months Ended June 30, 2003 |
Three Months Ended September 30, 2003 |
Three Months Ended December 31, 2003 |
Year Ended December 31, 2003 |
||||||||||||
|---|---|---|---|---|---|---|---|---|---|---|---|---|---|---|---|---|---|
| Revenues | $ | 1,297.7 | $ | 1,307.4 | $ | 1,275.7 | $ | 1,364.7 | $ | 5,245.5 | |||||||
| Gross profit | 135.4 | 154.4 | 136.4 | 158.2 | 584.4 | ||||||||||||
| Operating income: | |||||||||||||||||
| —as previously reported | 17.5 | 37.3 | 28.6 | N/A | |||||||||||||
| —as restated | 35.0 | 52.4 | 32.5 | 56.0 | 175.9 | ||||||||||||
| Net loss: | |||||||||||||||||
| —as previously reported | (50.0 | ) | (34.6 | ) | (32.3 | ) | N/A | ||||||||||
| —as restated | (32.1 | ) | (22.3 | ) | (25.9 | ) | (50.6 | ) | (130.9 | ) | |||||||
F-37
A summary of selected unaudited quarterly financial data for the years ended December 31, 2002 is as follows (dollars in millions):
| |
Three Months Ended March 31, 2002 |
Three Months Ended June 30, 2002 |
Three Months Ended September 30, 2002 |
Three Months Ended December 31, 2002 |
Year Ended December 31, 2002 |
||||||||||
|---|---|---|---|---|---|---|---|---|---|---|---|---|---|---|---|
| Revenues | $ | 997.9 | $ | 1,175.0 | $ | 1,195.2 | $ | 1,150.0 | $ | 4,518.1 | |||||
| Gross profit | 125.5 | 157.6 | 174.9 | 157.4 | 615.4 | ||||||||||
| Operating income | 24.5 | 81.8 | 67.9 | 53.9 | 228.1 | ||||||||||
| Net income (loss) | 2.1 | (0.2 | ) | 0.6 | 17.6 | 20.1 | |||||||||
During the years ended December 31, 2003 and 2002, the Company incurred $56.7 million and $7.7 million, respectively, of restructuring and plant closing costs, respectively. See, "Note 10—Restructuring and Plant Closing Costs."
23. Consolidating Condensed Financial Statements
The following are consolidating condensed financial statements which present, in separate columns: the Company carrying its investment in subsidiaries under the equity method; the HI Guarantors on a combined, or where appropriate, consolidated basis, carrying its investment in the Non-Guarantors under the equity method; and the Non-Guarantors on a consolidated basis. Additional columns present eliminating adjustments and consolidated totals as of December 31, 2003 and 2002 and for the years ended December 31, 2003, 2002 and 2001. There are no restrictions limiting transfers of cash from guarantor and non-guarantor subsidiaries to the Company. The combined Guarantors are wholly-owned subsidiaries of the Company and have fully and unconditionally guaranteed the Senior Notes and the Subordinated Notes on a joint and several basis. The Company has not presented separate financial statements and other disclosures concerning the combined Guarantors because management has determined that such information is not material to investors.
F-38
HUNTSMAN INTERNATIONAL LLC AND SUBSIDIARIES
CONSOLIDATING CONDENSED BALANCE SHEETS
YEAR ENDED DECEMBER 31, 2003
(Dollars in Millions)
| |
Parent Only Huntsman International |
Guarantors |
Non- Guarantors |
Eliminations |
Consolidated Huntsman International |
||||||||||||
|---|---|---|---|---|---|---|---|---|---|---|---|---|---|---|---|---|---|
| ASSETS | |||||||||||||||||
| Current Assets: | |||||||||||||||||
| Cash and cash equivalents | $ | 16.6 | $ | (0.3 | ) | $ | 81.5 | $ | — | $ | 97.8 | ||||||
| Accounts receivable, net | 63.5 | 91.3 | 515.0 | (105.4 | ) | 564.4 | |||||||||||
| Inventories | 47.9 | 78.6 | 470.4 | — | 596.9 | ||||||||||||
| Prepaid expenses | 5.8 | 1.7 | 16.1 | — | 23.6 | ||||||||||||
| Deferred tax asset | — | — | 3.0 | — | 3.0 | ||||||||||||
| Other current assets | 224.1 | 316.9 | 85.5 | (542.9 | ) | 83.6 | |||||||||||
| Total current assets | 357.9 | 488.2 | 1,171.5 | (648.3 | ) | 1,369.3 | |||||||||||
| Property, plant and equipment, net | 526.5 | 331.5 | 2,398.2 | — | 3,256.2 | ||||||||||||
| Investment in unconsolidated affiliates | 3,356.8 | 791.8 | 7.3 | (4,017.2 | ) | 138.7 | |||||||||||
| Intangible assets, net | 259.5 | 4.6 | 19.3 | — | 283.4 | ||||||||||||
| Other noncurrent assets | 80.5 | 1,696.9 | 355.2 | (1,687.5 | ) | 445.1 | |||||||||||
| Total assets | $ | 4,581.2 | $ | 3,313.0 | $ | 3,951.5 | $ | (6,353.0 | ) | $ | 5,492.7 | ||||||
| LIABILITIES AND EQUITY | |||||||||||||||||
| Current liabilities: | |||||||||||||||||
| Accounts payable | $ | 64.0 | $ | 68.3 | $ | 533.9 | $ | (104.9 | ) | $ | 561.3 | ||||||
| Accrued liabilities | 381.4 | 40.1 | 509.6 | (543.4 | ) | 387.7 | |||||||||||
| Current portion of long-term debt | 1.7 | — | 0.1 | — | 1.8 | ||||||||||||
| Total current liabilities | 447.1 | 108.4 | 1,043.6 | (648.3 | ) | 950.8 | |||||||||||
| Long-term debt | 2,926.5 | — | 1,686.3 | (1,687.5 | ) | 2,925.3 | |||||||||||
| Deferred income taxes | — | — | 234.8 | — | 234.8 | ||||||||||||
| Other noncurrent liabilities | 53.9 | — | 170.6 | — | 224.5 | ||||||||||||
| Total liabilities | 3,427.5 | 108.4 | 3,135.3 | (2,335.8 | ) | 4,335.4 | |||||||||||
| Minority interests | — | — | 3.6 | — | 3.6 | ||||||||||||
| Equity: | |||||||||||||||||
| Member's equity | 1,026.1 | — | — | — | 1,026.1 | ||||||||||||
| Subsidiary equity | — | 2,220.0 | 874.0 | (3,094.0 | ) | — | |||||||||||
| Retained earnings | 55.6 | 591.1 | (58.1 | ) | (533.0 | ) | 55.6 | ||||||||||
| Accumulated other comprehensive income (loss) | 72.0 | 393.5 | (3.3 | ) | (390.2 | ) | 72.0 | ||||||||||
| Total equity | 1,153.7 | 3,204.6 | 812.6 | (4,017.2 | ) | 1,153.7 | |||||||||||
| Total liabilities and equity | $ | 4,581.2 | $ | 3,313.0 | $ | 3,951.5 | $ | (6,353.0 | ) | $ | 5,492.7 | ||||||
F-39
HUNTSMAN INTERNATIONAL LLC AND SUBSIDIARIES
CONSOLIDATING CONDENSED BALANCE SHEETS
YEAR ENDED DECEMBER 31, 2002
(Dollars in Millions)
| |
Parent Only Huntsman International |
Guarantors |
Non- Guarantors |
Eliminations |
Consolidated Huntsman International |
|||||||||||||
|---|---|---|---|---|---|---|---|---|---|---|---|---|---|---|---|---|---|---|
| ASSETS | ||||||||||||||||||
| Current Assets: | ||||||||||||||||||
| Cash and cash equivalents | $ | 19.0 | $ | 0.3 | $ | 56.1 | $ | — | $ | 75.4 | ||||||||
| Accounts receivable, net | 97.0 | 113.8 | 378.5 | (115.4 | ) | 473.9 | ||||||||||||
| Inventories | 53.2 | 63.4 | 444.7 | — | 561.3 | |||||||||||||
| Prepaid expenses | 4.3 | 1.9 | 15.8 | — | 22.0 | |||||||||||||
| Other current assets | 68.8 | 245.5 | 130.4 | (344.1 | ) | 100.6 | ||||||||||||
| Total current assets | 242.3 | 424.9 | 1,025.5 | (459.5 | ) | 1,233.2 | ||||||||||||
| Property, plant and equipment, net | 562.3 | 339.3 | 2,169.5 | — | 3,071.1 | |||||||||||||
| Investment in unconsolidated affiliates | 3,098.0 | 717.4 | 1.5 | (3,683.0 | ) | 133.9 | ||||||||||||
| Intangible assets, net | 289.4 | 6.3 | 7.1 | — | 302.8 | |||||||||||||
| Other noncurrent assets | 87.9 | 1,599.0 | 332.5 | (1,593.1 | ) | 426.3 | ||||||||||||
| Total assets | $ | 4,279.9 | $ | 3,086.9 | $ | 3,536.1 | $ | (5,735.6 | ) | $ | 5,167.3 | |||||||
| LIABILITIES AND EQUITY | ||||||||||||||||||
| Current liabilities: | ||||||||||||||||||
| Accounts payable | $ | 73.2 | $ | 66.7 | $ | 544.2 | $ | (115.4 | ) | $ | 568.7 | |||||||
| Accrued liabilities | 308.8 | 31.0 | 302.9 | (30.7 | ) | 298.6 | ||||||||||||
| Current portion of long-term debt | 43.2 | — | 0.7 | — | 43.9 | |||||||||||||
| Total current liabilities | 425.2 | 97.7 | 847.8 | (459.5 | ) | 911.2 | ||||||||||||
| Long-term debt | 2,741.2 | — | 1,581.8 | (1,593.1 | ) | 2,729.9 | ||||||||||||
| Deferred income taxes | — | — | 215.1 | — | 215.1 | |||||||||||||
| Other noncurrent liabilities | 48.3 | 3.8 | 193.8 | — | 245.9 | |||||||||||||
| Total liabilities | 3,214.7 | 101.5 | 2,838.5 | (2,052.6 | ) | 4,102.1 | ||||||||||||
| Equity: | ||||||||||||||||||
| Member's equity | 1,026.1 | — | — | — | 1,026.1 | |||||||||||||
| Subsidiary equity | — | 2,408.8 | 772.8 | (3,181.6 | ) | — | ||||||||||||
| Retained earnings | 186.5 | 675.7 | 34.9 | (710.6 | ) | 186.5 | ||||||||||||
| Accumulated other comprehensive loss | (147.4 | ) | (99.1 | ) | (110.1 | ) | 209.2 | (147.4 | ) | |||||||||
| Total equity | 1,065.2 | 2,985.4 | 697.6 | (3,683.0 | ) | 1,065.2 | ||||||||||||
| Total liabilities and equity | $ | 4,279.9 | $ | 3,086.9 | $ | 3,536.1 | $ | (5,735.6 | ) | $ | 5,167.3 | |||||||
F-40
HUNTSMAN INTERNATIONAL LLC AND SUBSIDIARIES
CONSOLIDATING STATEMENTS OF OPERATIONS AND COMPREHENSIVE INCOME (LOSS)
YEAR ENDED DECEMBER 31, 2003
(Dollars in Millions)
| |
Parent Only Huntsman International |
Guarantors |
Non- Guarantors |
Eliminations |
Consolidated Huntsman International |
|||||||||||||
|---|---|---|---|---|---|---|---|---|---|---|---|---|---|---|---|---|---|---|
| Revenues: | ||||||||||||||||||
| Trade sales and services | $ | 705.0 | $ | 676.0 | $ | 3,660.7 | $ | — | $ | 5,041.7 | ||||||||
| Related party sales | 138.7 | 118.6 | 201.0 | (254.5 | ) | 203.8 | ||||||||||||
| Total revenue | 843.7 | 794.6 | 3,861.7 | (254.5 | ) | 5,245.5 | ||||||||||||
| Cost of goods sold | 684.4 | 717.6 | 3,513.6 | (254.5 | ) | 4,661.1 | ||||||||||||
| Gross profit | 159.3 | 77.0 | 348.1 | — | 584.4 | |||||||||||||
Expenses: |
||||||||||||||||||
| Selling, general and administrative | 65.2 | (3.4 | ) | 240.6 | — | 302.4 | ||||||||||||
| Research and development | 37.7 | 1.9 | 9.8 | — | 49.4 | |||||||||||||
| Restructuring and plant closing costs | — | — | 56.7 | — | 56.7 | |||||||||||||
| Total expenses | 102.9 | (1.5 | ) | 307.1 | — | 408.5 | ||||||||||||
| Operating income | 56.4 | 78.5 | 41.0 | — | 175.9 | |||||||||||||
Interest (expense) income, net |
(254.4 |
) |
150.0 |
(147.1 |
) |
— |
(251.5 |
) |
||||||||||
| Gain (loss) on sale of accounts receivable | (64.3 | ) | (2.8 | ) | 34.7 | — | (32.4 | ) | ||||||||||
| Equity in earnings (losses) of unconsolidated affiliates | 132.7 | (141.1 | ) | — | 8.4 | — | ||||||||||||
| Other income (expense) | (1.3 | ) | — | — | — | (1.3 | ) | |||||||||||
| Income (loss) before income taxes | (130.9 | ) | 84.6 | (71.4 | ) | 8.4 | (109.3 | ) | ||||||||||
| Income tax (expense) benefit | — | — | (21.6 | ) | — | (21.6 | ) | |||||||||||
| Net income (loss) | (130.9 | ) | 84.6 | (93.0 | ) | 8.4 | (130.9 | ) | ||||||||||
Other comprehensive income (loss) |
219.4 |
492.6 |
106.8 |
(599.4 |
) |
219.4 |
||||||||||||
| Comprehensive income (loss) | $ | 88.5 | $ | 577.2 | $ | 13.8 | $ | (591.0 | ) | $ | 88.5 | |||||||
F-41
HUNTSMAN INTERNATIONAL LLC AND SUBSIDIARIES
CONSOLIDATING STATEMENTS OF OPERATIONS AND COMPREHENSIVE INCOME (LOSS)
YEAR ENDED DECEMBER 31, 2002
(Dollars in Millions)
| |
Parent Only Huntsman International |
Guarantors |
Non- Guarantors |
Eliminations |
Consolidated Huntsman International |
|||||||||||||
|---|---|---|---|---|---|---|---|---|---|---|---|---|---|---|---|---|---|---|
| Revenues: | ||||||||||||||||||
| Trade sales and services | $ | 674.3 | $ | 604.6 | $ | 2,881.0 | $ | — | $ | 4,159.9 | ||||||||
| Related party sales | 129.2 | 111.4 | 331.5 | (238.4 | ) | 333.7 | ||||||||||||
| Tolling fees | — | 23.9 | 0.6 | — | 24.5 | |||||||||||||
| Total revenue | 803.5 | 739.9 | 3,213.1 | (238.4 | ) | 4,518.1 | ||||||||||||
| Cost of goods sold | 573.2 | 603.2 | 2,964.7 | (238.4 | ) | 3,902.7 | ||||||||||||
| Gross profit | 230.3 | 136.7 | 248.4 | — | 615.4 | |||||||||||||
Expenses: |
||||||||||||||||||
| Selling, general and administrative | 100.1 | 8.1 | 216.8 | — | 325.0 | |||||||||||||
| Research and development | 35.1 | 1.7 | 17.8 | — | 54.6 | |||||||||||||
| Restructuring and plant closing costs | — | — | 7.7 | — | 7.7 | |||||||||||||
| Total expenses | 135.2 | 9.8 | 242.3 | — | 387.3 | |||||||||||||
| Operating income | 95.1 | 126.9 | 6.1 | — | 228.1 | |||||||||||||
Interest (expense) income, net |
(248.9 |
) |
117.9 |
(114.4 |
) |
— |
(245.4 |
) |
||||||||||
| Gain (loss) on sale of accounts recievable | 0.6 | (3.3 | ) | (2.8 | ) | — | (5.5 | ) | ||||||||||
| Equity in earnings (losses) of unconsolidated affiliates | 173.6 | (79.6 | ) | — | (93.8 | ) | 0.2 | |||||||||||
| Other income (expense) | 0.1 | 0.1 | 0.9 | — | 1.1 | |||||||||||||
| Income (loss) before income taxes | 20.5 | 162.0 | (110.2 | ) | (93.8 | ) | (21.5 | ) | ||||||||||
| Income tax (expense) benefit | (0.4 | ) | 0.1 | 41.8 | — | 41.5 | ||||||||||||
| Minority interests in subsidiaries income | — | — | 0.1 | — | 0.1 | |||||||||||||
| Net income (loss) | 20.1 | 162.1 | (68.3 | ) | (93.8 | ) | 20.1 | |||||||||||
Other comprehensive income (loss) |
53.4 |
155.9 |
(16.7 |
) |
(139.2 |
) |
53.4 |
|||||||||||
Comprehensive income (loss) |
$ |
73.5 |
$ |
318.0 |
$ |
(85.0 |
) |
$ |
(233.0 |
) |
$ |
73.5 |
||||||
F-42
HUNTSMAN INTERNATIONAL LLC AND SUBSIDIARIES
CONSOLIDATING STATEMENTS OF OPERATIONS AND COMPREHENSIVE INCOME (LOSS)
YEAR ENDED DECEMBER 31, 2001
(Dollars in Millions)
| |
Parent Only Huntsman International |
Guarantors |
Non- Guarantors |
Eliminations |
Consolidated Huntsman International |
|||||||||||||
|---|---|---|---|---|---|---|---|---|---|---|---|---|---|---|---|---|---|---|
| Revenues: | ||||||||||||||||||
| Trade sales and services | $ | 615.1 | $ | 638.6 | $ | 2,924.5 | $ | — | $ | 4,178.2 | ||||||||
| Related party sales | 148.9 | 150.0 | 375.1 | (298.0 | ) | 376.0 | ||||||||||||
| Tolling fees | — | 20.5 | 0.5 | — | 21.0 | |||||||||||||
| Total revenue | 764.0 | 809.1 | 3,300.1 | (298.0 | ) | 4,575.2 | ||||||||||||
| Cost of goods sold | 577.5 | 712.3 | 2,998.3 | (298.0 | ) | 3,990.1 | ||||||||||||
| Gross profit | 186.5 | 96.8 | 301.8 | — | 585.1 | |||||||||||||
Expenses: |
||||||||||||||||||
| Selling, general and administrative | 93.6 | 19.3 | 191.9 | — | 304.8 | |||||||||||||
| Research and development | 52.3 | 3.3 | 6.9 | — | 62.5 | |||||||||||||
| Restructuring and plant closing costs | 3.4 | — | 43.2 | — | 46.6 | |||||||||||||
| Total expenses | 149.3 | 22.6 | 242.0 | — | 413.9 | |||||||||||||
| Operating income | 37.2 | 74.2 | 59.8 | — | 171.2 | |||||||||||||
Interest (expense) income, net |
(247.0 |
) |
107.7 |
(100.3 |
) |
— |
(239.6 |
) |
||||||||||
| Gain (loss) on sale of accounts receivable | (2.5 | ) | (4.5 | ) | (5.8 | ) | — | (12.8 | ) | |||||||||
| Equity in earnings (losses) of unconsolidated affiliates | 156.6 | (25.4 | ) | 0.1 | (131.2 | ) | 0.1 | |||||||||||
| Other income (expense) | (3.5 | ) | — | 1.4 | — | (2.1 | ) | |||||||||||
| Income (loss) before income taxes | (59.2 | ) | 152.0 | (44.8 | ) | (131.2 | ) | (83.2 | ) | |||||||||
| Income tax (expense) benefit | (0.2 | ) | (0.1 | ) | 26.3 | — | 26.0 | |||||||||||
| Minority interests in subsidiaries income | — | — | (2.2 | ) | — | (2.2 | ) | |||||||||||
| Income (loss) before accounting change | (59.4 | ) | 151.9 | (20.7 | ) | (131.2 | ) | (59.4 | ) | |||||||||
| Cumulative effect of accounting change | (1.5 | ) | — | — | — | (1.5 | ) | |||||||||||
| Net income (loss) | (60.9 | ) | 151.9 | (20.7 | ) | (131.2 | ) | (60.9 | ) | |||||||||
Other comprehensive income (loss) |
(80.1 |
) |
(85.5 |
) |
(37.5 |
) |
123.0 |
(80.1 |
) |
|||||||||
| Comprehensive income (loss) | $ | (141.0 | ) | $ | 66.4 | $ | (58.2 | ) | $ | (8.2 | ) | $ | (141.0 | ) | ||||
F-43
HUNTSMAN INTERNATIONAL LLC AND SUBSIDIARIES
CONSOLIDATING CONDENSED STATEMENTS OF CASH FLOW
YEAR ENDED DECEMBER 31, 2003
(Dollars in Millions)
| |
Parent Only Huntsman International |
Guarantors |
Non- Guarantors |
Eliminations |
Consolidated Huntsman International |
|||||||||||
|---|---|---|---|---|---|---|---|---|---|---|---|---|---|---|---|---|
| Net cash used in operating activities | $ | (237.4 | ) | $ | 224.2 | $ | 61.7 | $ | — | $ | 48.5 | |||||
Investing activities: |
||||||||||||||||
| Capital expenditures | (6.9 | ) | (9.5 | ) | (111.0 | ) | — | (127.4 | ) | |||||||
| Investment in unconsolidated affiliate | — | — | (6.1 | ) | — | (6.1 | ) | |||||||||
| Net cash received from unconsolidated affiliates | — | 0.8 | — | — | 0.8 | |||||||||||
| Advances to unconsolidated affiliates | (3.0 | ) | — | — | — | (3.0 | ) | |||||||||
| Net cash used in investing activities | (9.9 | ) | (8.7 | ) | (117.1 | ) | — | (135.7 | ) | |||||||
| Financing activities: | ||||||||||||||||
| Net borrowings under revolving loan facilities | (45.0 | ) | — | — | — | (45.0 | ) | |||||||||
| Issuance of senior notes | 157.9 | — | — | — | 157.9 | |||||||||||
| Proceeds from long term debt | 205.0 | — | — | — | 205.0 | |||||||||||
| Repayment of long term debt | (259.1 | ) | — | (4.9 | ) | — | (264.0 | ) | ||||||||
| Net borrowings under overdraft facilities | 7.5 | — | — | — | 7.5 | |||||||||||
| Cash contributions by parent | — | 248.9 | 4,159.5 | (4,408.4 | ) | — | ||||||||||
| Cash distributions from subsidiaries | 4,716.7 | — | — | (4,716.7 | ) | — | ||||||||||
| Cash distributions to parent | — | (548.9 | ) | (4,167.8 | ) | 4,716.7 | — | |||||||||
| Cash distributions to subsidiaries | (4,408.4 | ) | — | — | 4,408.4 | — | ||||||||||
| Shares issued to minorities for cash | — | — | 2.7 | — | 2.7 | |||||||||||
| Debt issuance costs | (9.7 | ) | — | — | — | (9.7 | ) | |||||||||
| Intercompany advances—net of repayments | (13.3 | ) | 42.0 | (28.7 | ) | — | — | |||||||||
| Net cash provided by (used in) financing activities | 351.6 | (258.0 | ) | (39.2 | ) | — | 54.4 | |||||||||
Effect of exchange rate changes on cash |
(106.7 |
) |
41.9 |
120.0 |
— |
55.2 |
||||||||||
| Increase in cash and cash equivalents | (2.4 | ) | (0.6 | ) | 25.4 | — | 22.4 | |||||||||
| Cash and cash equivalents at beginning of period | 19.0 | 0.3 | 56.1 | — | 75.4 | |||||||||||
| Cash and cash equivalents at end of period | $ | 16.6 | $ | (0.3 | ) | $ | 81.5 | $ | — | $ | 97.8 | |||||
F-44
HUNTSMAN INTERNATIONAL LLC AND SUBSIDIARIES
CONSOLIDATING CONDENSED STATEMENTS OF CASH FLOW
YEAR ENDED DECEMBER 31, 2002
(Dollars in Millions)
| |
Parent Only Huntsman International |
Guarantors |
Non- Guarantors |
Eliminations |
Consolidated Huntsman International |
|||||||||||
|---|---|---|---|---|---|---|---|---|---|---|---|---|---|---|---|---|
| Net cash used in operating activities | $ | (80.6 | ) | $ | 227.3 | $ | 10.8 | $ | — | $ | 157.5 | |||||
Investing activities: |
||||||||||||||||
| Capital expenditures | (9.4 | ) | (3.1 | ) | (178.0 | ) | — | (190.5 | ) | |||||||
| Acquisition minority interest | — | — | (9.0 | ) | — | (9.0 | ) | |||||||||
| Net cash received from unconsolidated affiliates | — | 8.0 | — | — | 8.0 | |||||||||||
| Advances to unconsolidated affiliates | (3.3 | ) | — | — | — | (3.3 | ) | |||||||||
| Proceeds from sale of fixed assets | (0.4 | ) | — | 6.3 | — | 5.9 | ||||||||||
| Net cash used in investing activities | (13.1 | ) | 4.9 | (180.7 | ) | — | (188.9 | ) | ||||||||
Financing activities: |
||||||||||||||||
| Net borrowings (repayments) under revolving loan facilities | (43.6 | ) | — | — | — | (43.6 | ) | |||||||||
| Issuance of senior notes | 300.0 | — | — | — | 300.0 | |||||||||||
| Repayment of long term debt | (247.2 | ) | — | 2.2 | — | (245.0 | ) | |||||||||
| Debt issuance costs | (10.3 | ) | — | — | — | (10.3 | ) | |||||||||
| Cash contributions by parent | — | 441.5 | 3,232.5 | (3,674.0 | ) | — | ||||||||||
| Cash distributions from subsidiaries | 3,612.5 | — | — | (3,612.5 | ) | — | ||||||||||
| Cash distributions to parent | — | (431.8 | ) | (3,180.7 | ) | 3,612.5 | — | |||||||||
| Cash distributions to subsidiaries | (3,674.0 | ) | — | — | 3,674.0 | — | ||||||||||
| Intercompany advances—net of repayments | 153.2 | (244.4 | ) | 91.2 | — | — | ||||||||||
| Net cash provided by (used in) financing activities | 90.6 | (234.7 | ) | 145.2 | — | 1.1 | ||||||||||
| Effect of exchange rate changes on cash | 1.1 | — | 20.7 | — | 21.8 | |||||||||||
| Increase in cash and cash equivalents | (2.0 | ) | (2.5 | ) | (4.0 | ) | — | (8.5 | ) | |||||||
| Cash and cash equivalents at beginning of period | 21.0 | 2.8 | 60.1 | — | 83.9 | |||||||||||
| Cash and cash equivalents at end of period | $ | 19.0 | $ | 0.3 | $ | 56.1 | $ | — | $ | 75.4 | ||||||
F-45
HUNTSMAN INTERNATIONAL LLC AND SUBSIDIARIES
CONSOLIDATING CONDENSED STATEMENTS OF CASH FLOW
YEAR ENDED DECEMBER 31, 2001
(Dollars in Millions)
| |
Parent Only Huntsman International |
Guarantors |
Non- Guarantors |
Eliminations |
Consolidated Huntsman International |
|||||||||||
|---|---|---|---|---|---|---|---|---|---|---|---|---|---|---|---|---|
| Net cash used in operating activities | $ | (117.0 | ) | $ | 172.2 | $ | 147.2 | $ | — | $ | 202.4 | |||||
Investing activities: |
||||||||||||||||
| Capital expenditures | (48.2 | ) | (4.0 | ) | (238.8 | ) | — | (291.0 | ) | |||||||
| Acquisition of other businesses | (33.8 | ) | (29.1 | ) | (146.6 | ) | — | (209.5 | ) | |||||||
| Net cash received from unconsolidated affiliates | — | 11.3 | — | — | 11.3 | |||||||||||
| Advances to unconsolidated affiliates | (2.5 | ) | — | — | — | (2.5 | ) | |||||||||
| Net cash used in investing activities | (84.5 | ) | (21.8 | ) | (385.4 | ) | — | (491.7 | ) | |||||||
Financing activities: |
||||||||||||||||
| Net borrowings under revolving loan facilities | 79.5 | — | — | — | 79.5 | |||||||||||
| Issuance of senior subordinated notes | 233.2 | — | — | — | 233.2 | |||||||||||
| Proceeds from other long-term debt | — | — | 4.4 | — | 4.4 | |||||||||||
| Repayment of other long-term debt | — | — | (2.4 | ) | — | (2.4 | ) | |||||||||
| Debt issuance costs | (6.5 | ) | — | — | — | (6.5 | ) | |||||||||
| Cash contributions by parent | 4.0 | 831.3 | 3,183.1 | (4,014.4 | ) | 4.0 | ||||||||||
| Cash distributions from subsidiaries | 3,935.9 | — | — | (3,935.9 | ) | — | ||||||||||
| Cash distributions to parent | — | (744.5 | ) | (3,191.4 | ) | 3,935.9 | — | |||||||||
| Cash distributions to subsidiaries | (3,963.3 | ) | (51.1 | ) | — | 4,014.4 | — | |||||||||
| Intercompany advances—net of repayments | (50.3 | ) | (183.3 | ) | 233.6 | — | — | |||||||||
| Net cash provided by (used in) financing activities | 232.5 | (147.6 | ) | 227.3 | — | 312.2 | ||||||||||
| Effect of exchange rate changes on cash | (15.7 | ) | — | 10.6 | — | (5.1 | ) | |||||||||
| Increase in cash and cash equivalents | 15.3 | 2.8 | (0.3 | ) | — | 17.8 | ||||||||||
| Cash and cash equivalents at beginning of period | 5.7 | — | 60.4 | — | 66.1 | |||||||||||
| Cash and cash equivalents at end of period | $ | 21.0 | $ | 2.8 | $ | 60.1 | $ | — | $ | 83.9 | ||||||
F-46
HUNTSMAN INTERNATIONAL LLC AND SUBSIDIARIES
Schedule II—Valuation and Qualifying Accounts
| Column A |
Column B |
Column C |
Column D |
Column E |
||||||||||||
|---|---|---|---|---|---|---|---|---|---|---|---|---|---|---|---|---|
| |
|
Additions |
|
|
||||||||||||
| Description |
Balance at Beginning of Period |
Charged to cost and expenses |
Charged to other accounts |
Deductions |
Balance at End of Period |
|||||||||||
| Allowance for Doubtful Accounts | ||||||||||||||||
| Year Ended December 31, 2003 | $ | 14.5 | $ | 10.2 | $ | — | $ | (11.3 | ) | $ | 13.4 | |||||
| Year Ended December 31, 2002 | $ | 15.2 | $ | 4.1 | $ | — | $ | (4.8 | ) | $ | 14.5 | |||||
| Year Ended December 31, 2001 | $ | 10.6 | $ | 2.8 | $ | 3.0 | (1) | $ | (1.2 | ) | $ | 15.2 | ||||
F-47
| Number |
Description of Exhibits |
|
|---|---|---|
| 3.1 | Certificate of Formation of Huntsman International LLC (incorporated by reference to Exhibit 3.1 to our registration statement on Form S-4 (File No. 333-85141)) | |
3.2 |
Second Amended and Restated Limited Liability Company Agreement of Huntsman International LLC dated December 20, 2001 (incorporated by reference to Exhibit 3.2 to amendment no. 1 to our annual report on Form 10- K/A for the year ended December 31, 2001) |
|
3.3 |
Certificate of Formation of Huntsman International Financial LLC (incorporated by reference to Exhibit 3.3 to our registration statement on Form S-4 (File No. 333-85141)) |
|
3.4 |
Limited Liability Company Agreement of Huntsman International Financial LLC dated June 18, 1999, as amended by the First Amendment dated June 19, 1999 (incorporated by reference to Exhibit 3.4 to our registration statement on Form S-4 (File No. 333-85141)) |
|
3.5 |
Memorandum of Association of Tioxide Group (incorporated by reference to Exhibit 3.5 to our registration statement on Form S-4 (File No. 333-85141)) |
|
3.6 |
Articles of Association of Tioxide Group (incorporated by reference to Exhibit 3.6 to our registration statement on Form S-4 (File No. 333-85141)) |
|
3.7 |
Memorandum of Association of Tioxide Americas Inc. (incorporated by reference to Exhibit 3.7 to our registration statement on Form S-4 (File No. 333-85141)) |
|
3.8 |
Articles of Association of Tioxide Americas Inc. (incorporated by reference to Exhibit 3.8 to our registration statement on Form S-4 (File No. 333-85141)) |
|
3.9 |
Certificate of Amendment to Certificate of Formation of Huntsman International LLC (incorporated by reference to Exhibit 3.9 to our annual report on Form 10-K for the year ended December 31, 2000) |
|
3.10 |
Certificate of Amendment to Certificate of Formation of Huntsman International Financial LLC (incorporated by reference to Exhibit 3.10 to our annual report on Form 10-K for the year ended December 31, 2000) |
|
3.11 |
Certificate of Formation of Huntsman Propylene Oxide Holdings LLC (incorporated by reference to Exhibit 3.7 to our registration statement on Form S-4 (File No. 333-58578)) |
|
3.12 |
Limited Liability Company Agreement of Huntsman Propylene Oxide Holdings LLC dated July 12, 2000 (incorporated by reference to Exhibit 3.8 to our registration statement on Form S-4 (File No. 333-58578)) |
|
3.13 |
Certificate of Formation of Huntsman EA Holdings LLC (incorporated by reference to Exhibit 3.9 to our registration statement on Form S-4 (File No. 333-58578)) |
|
3.14 |
Limited Liability Company Agreement of Huntsman EA Holdings LLC dated December 22, 2000 (incorporated by reference to Exhibit 3.10 to our registration statement on Form S-4 (File No. 333-58578)) |
|
3.15 |
Certificate of Formation of Huntsman Texas Holdings LLC (incorporated by reference to Exhibit 3.11 to our registration statement on Form S-4 (File No. 333-58578)) |
|
3.16 |
Limited Liability Company Agreement of Huntsman Texas Holdings LLC dated July 12, 2000 (incorporated by reference to Exhibit 3.12 to our registration statement on Form S-4 (File No. 333-58578)) |
|
3.17 |
Certificate of Formation of Eurofuels LLC (incorporated by reference to Exhibit 3.13 to our registration statement on Form S-4 (File No. 333-58578)) |
|
3.18 |
Limited Liability Company Agreement of Eurofuels LLC dated July 12, 2000 (incorporated by reference to Exhibit 3.14 to our registration statement on Form S-4 (File No. 333-58578)) |
|
3.19 |
Certificate of Formation of Eurostar Industries LLC (incorporated by reference to Exhibit 3.15 to our registration statement on Form S-4 (File No. 333-58578)) |
|
3.20 |
Limited Liability Company Agreement of Eurostar Industries LLC dated July 12, 2000 (incorporated by reference to Exhibit 3.16 to our registration statement on Form S-4 (File No. 333-58578)) |
|
3.21 |
Certificate of Limited Partnership of Huntsman Ethyleneamines Ltd. (incorporated by reference to Exhibit 3.17 to our registration statement on Form S-4 (File No. 333-58578)) |
|
3.22 |
Articles of Limited Partnership of Huntsman Ethyleneamines Ltd. dated January 5, 2001 (incorporated by reference to Exhibit 3.18 to our registration statement on Form S-4 (File No. 333-58578)) |
|
3.23 |
Certificate of Limited Partnership of Huntsman Propylene Oxide Ltd. (incorporated by reference to Exhibit 3.19 to our registration statement on Form S-4 (File No. 333-58578)) |
|
3.24 |
First Amended and Restated Articles of Limited Partnership of Huntsman Propylene Oxide Ltd. dated October 1, 2000 (incorporated by reference to Exhibit 3.20 to our registration statement on Form S-4 (File No. 333-58578)) |
|
3.25 |
Certificate of Limited Partnership of Huntsman International Fuels, L.P. (incorporated by reference to Exhibit 3.21 to our registration statement on Form S-4 (File No. 333-58578)) |
|
3.26 |
Certificate of First Amendment to Certificate of Limited Partnership of Huntsman International Fuels, L.P. (incorporated by reference to Exhibit 3.22 to our registration statement on Form S-4 (File No. 333-58578)) |
|
3.27 |
First Amended and Restated Articles of Limited Partnership of Huntsman International Fuels, L.P. dated October 1, 2000 (incorporated by reference to Exhibit 3.23 to our registration statement on Form S-4 (File No. 333-58578)) |
|
4.1 |
Indenture, dated as of June 30, 1999, among Huntsman International LLC (f/k/a Huntsman ICI Chemicals LLC), the Guarantors party thereto and Bank One, N.A., as Trustee, relating to the 101/8% Senior Subordinated Notes due 2009 (incorporated by reference to Exhibit 4.1 to our registration statement on Form S-4 (File No. 333-85141)) |
|
4.2 |
Form of 101/8% Senior Subordinated Note due 2009 denominated in dollars (included as Exhibit A-3 to Exhibit 4.1) |
|
4.3 |
Form of 101/8% Senior Subordinated Note due 2009 denominated in euros (included as Exhibit A-4 to Exhibit 4.1) |
|
4.4 |
Form of Guarantee relating to the 101/8% Senior Subordinated Notes due 2009 (included as Exhibit E of Exhibit 4.1) |
|
4.5 |
First Amendment, dated January 5, 2000, to Indenture, dated as of June 30, 1999, among Huntsman International LLC (f/k/a Huntsman ICI Chemicals LLC), as Issuer, each of the Guarantors named therein and Bank One, N.A., as Trustee (incorporated by reference to Exhibit 4.6 to our registration statement on Form S-4 (File No. 333-85141)) |
|
4.6 |
Indenture, dated as of March 13, 2001, among Huntsman International LLC, as Issuer, the Guarantors named therein and The Bank of New York, as Trustee, relating to 101/8% Senior Subordinated Notes due 2009 (incorporated by reference to Exhibit 4.6 to amendment no. 1 to our annual report on Form 10-K/A for the year ended December 31, 2001) |
|
4.7 |
Form of 101/8% Senior Subordinated Note due 2009 denominated in dollars (included as Exhibit A-3 to Exhibit 4.6) |
|
4.8 |
Form of 101/8% Senior Subordinated Note due 2009 denominated in euros (included as Exhibit A-4 to Exhibit 4.6) |
|
4.9 |
Form of Guarantee relating to the 101/8% Senior Subordinated Notes due 2009 (included as Exhibit E of Exhibit 4.6) |
|
4.10 |
First Supplemental Indenture, dated as of January 11, 2002, among Huntsman International LLC, as Issuer, the Guarantors named therein and The Bank of New York, as Trustee, relating to 101/8% Senior Subordinated Notes due 2009 (incorporated by reference to Exhibit 4.7 to amendment no. 1 to our annual report on Form 10- K/A for the year ended December 31, 2001) |
|
4.11 |
Indenture, dated as of March 21, 2002, among Huntsman International LLC, as Issuer, the Guarantors named therein and Wells Fargo Bank Minnesota, National Association, as Trustee, relating to the 97/8% Senior Notes due 2009 (incorporated by reference to Exhibit 4.8 to amendment no. 1 to our annual report on Form 10-K/A for the year ended December 31, 2001) |
|
4.12 |
Form of 97/8% Senior Note due 2009 denominated in dollars (included as Exhibit A-3 to Exhibit 4.11) |
|
4.13 |
Form of 97/8% Senior Note due 2009 denominated in euros (included as Exhibit A-4 to Exhibit 4.11) |
|
4.14 |
Form of Guarantee relating to the 97/8% Senior Notes due 2009 (included as Exhibit E of Exhibit 4.11) |
|
4.15 |
Amended and Restated Guarantee, dated as of April 11, 2003, among the Guarantors named therein and Wells Fargo Bank Minnesota, National Association, as Trustee, relating to the 97/8% Senior Notes due 2009 (incorporated by reference to Exhibit 4.15 to our registration statement on Form S-4 (File No. 333-106482)) |
|
4.16 |
Exchange and Registration Rights Agreement, dated as of March 21, 2002, among Huntsman International LLC, the Guarantors as defined therein, and the Purchasers as defined therein, relating to the 97/8% Senior Notes due 2009 (incorporated by reference to Exhibit 4.9 to amendment no. 1 to our annual report on Form 10-K/A for the year ended December 31, 2001) |
|
4.17 |
Exchange and Registration Rights Agreement, dated as of April 11, 2003, among Huntsman International LLC, the Guarantors, as defined therein, and the Purchasers as defined therein, relating to the 97/8% Senior Notes due 2009 (incorporated by reference to Exhibit 4.17 to our registration statement on Form S-4 (File No. 333-106482)) |
|
10.1 |
Contribution Agreement, dated as of April 15, 1999, by and among Imperial Chemical Industries PLC, Huntsman Specialty Chemicals Corporation, Huntsman International Holdings LLC (f/k/a Huntsman ICI Holdings LLC) and Huntsman International LLC (f/k/a Huntsman ICI Chemicals LLC) as amended by the first Amending Agreement, dated June 4, 1999, the second Amending Agreement, dated June 30, 1999, and the third Amending Agreement, dated June 30, 1999 (incorporated by reference to Exhibit 10.1 to our registration statement on Form S-4 (File No. 333-85141)) |
|
10.2 |
Purchase and Sale Agreement (PO/MTBE Business), dated March 21, 1997, among Texaco, Texaco Chemical Inc. and Huntsman Specialty Chemicals Corporation (incorporated by reference to Exhibit 10.2 to our registration statement on Form S-4 (File No. 333-85141)) |
|
10.3 |
Operating and Maintenance Agreement, dated as of March 21, 1997, by and between Huntsman Specialty Chemicals Corporation and Huntsman Petrochemical Corporation (incorporated by reference to Exhibit 10.3 to our registration statement on Form S-4 (File No. 333-85141)) |
|
10.4 |
Credit Agreement, dated as of June 30, 1999, by and among Huntsman International LLC (f/k/a Huntsman ICI Chemicals LLC), Huntsman International Holdings LLC (f/k/a Huntsman ICI Holdings LLC), Bankers Trust Company, Goldman Sachs Credit Partners LP, The Chase Manhattan Bank, and Warburg Dillon Read and various lending institutions party thereto (incorporated by reference to Exhibit 10.4 to our registration statement on Form S-4 (File No. 333-85141)) |
|
10.5 |
Asset Sale Agreement, dated June 30, 1999, by and between BP Chemicals Limited and Huntsman International LLC (f/k/a Huntsman ICI Chemicals LLC) (incorporated by reference to Exhibit 10.5 to our registration statement on Form S-4 (File No. 333-85141)) |
|
10.6 |
First Amendment, dated as of December 21, 2000, by and among Huntsman International LLC, Huntsman International Holdings LLC, the financial institutions named therein, as Lenders, Bankers Trust Company, as Lead Arranger, Administrative Agent for the Lenders and Sole Book Manager, Goldman Sachs Credit Partners L.P., as Syndication Agent and Co-Arranger and The Chase Manhattan Bank and Warburg Dillon Read (a division of UBS AG), as Co-Arrangers and as Co-Documentation Agents, to the Credit Agreement dated as of June 30, 1999 (incorporated by reference to Exhibit 10.15 to our annual report on Form 10-K for the year ended December 31, 2000) |
|
10.7 |
Second Amendment, dated as of March 5, 2001, is entered into by and among Huntsman International LLC, Huntsman International Holdings LLC, the undersigned financial institutions, including Bankers Trust Company, in their capacities as lenders hereunder, Bankers Trust Company, as Lead Arranger, Administrative Agent for the Lenders and Sole Book Manager, Goldman Sachs Credit Partners L.P., as Syndication Agent and Co-Arranger and The Chase Manhattan Bank and UBS Warburg LLC (as successor to Warburg Dillon Read), as Co-Arrangers and as Co-Documentation Agents, to the Credit Agreement dated as of June 30, 1999 (incorporated by reference to Exhibit 10.16 to our annual report on Form 10-K for the year ended December 31, 2000) |
|
10.8 |
Contribution Agreement, among Huntsman International LLC, as Contributor and Originator, and Huntsman Receivables Finance LLC, as the Company, dated as of December 20, 2000 (incorporated by reference to Exhibit 10.17 to our annual report on Form 10-K for the year ended December 31, 2000) |
|
10.9 |
Huntsman Master Trust Pooling Agreement, dated as of December 21, 2000, among Huntsman Receivables Finance LLC, as Company, Huntsman (Europe) BVBA, as Master Servicer, and Chase Manhattan Bank (Ireland) Plc, as Trustee (incorporated by reference to Exhibit 10.18 to our annual report on Form 10-K for the year ended December 31, 2000) |
|
10.10 |
Huntsman Master Trust, Series 2000-1 Supplement, dated as of December 21, 2000, to Pooling Agreement dated as of December 21, 2000, among Huntsman Receivables Finance LLC, as Company, Huntsman (Europe), BVBA, as Master Servicer, The Chase Manhattan Bank, as Funding Agent, Park Avenue Receivables Corp., as Series 2000-1 Initial Purchaser, the several financial institutions party thereto from time to time as Series 2000-1 APA Banks, and Chase Manhattan Bank (Ireland) Plc, as Trustee (incorporated by reference to Exhibit 10.19 to our annual report on Form 10-K for the year ended December 31, 2000) |
|
10.11 |
Servicing Agreement, dated as of December 21, 2000, among Huntsman Receivables Finance LLC, as the Company, Huntsman (Europe) BVBA, as Master Servicer, Tioxide Americas Inc., Huntsman ICI Holland B.V., Tioxide Europe Limited, Huntsman International LLC, Huntsman Petrochemicals (U.K.) Limited, Huntsman Propylene Oxide Ltd., Huntsman International Fuels L.P., as Local Servicers, Chase Manhattan Bank (Ireland) Plc, as Trustee, Pricewaterhousecoopers, as Liquidation Servicer, and Huntsman International LLC, as Servicer Guarantor (incorporated by reference to Exhibit 10.20 to our annual report on Form 10-K for the year ended December 31, 2000) |
|
10.12 |
U.S. Receivables Purchase Agreement, Huntsman International LLC, as Purchaser, and Tioxide Americas Inc., Huntsman Propylene Oxide Ltd. and Huntsman International Fuels, L.P., each as a Seller and an Originator (incorporated by reference to Exhibit 10.21 to our annual report on Form 10-K for the year ended December 31, 2000) |
|
10.13 |
Dutch Receivables Purchase Agreement, dated as of December 21, 2000, between Huntsman International LLC, as Purchaser, Huntsman ICI Holland B.V., as Originator, Huntsman ICI (Europe) B.V.B.A., as Master Servicer (incorporated by reference to Exhibit 10.22 to our annual report on Form 10-K for the year ended December 31, 2000) |
|
10.14 |
U.K. Receivables Purchase Agreement, dated as of December 20, 2000, between Huntsman International LLC, as Purchaser, Tioxide Europe Limited and Huntsman Petrochemicals (U.K.) Limited, as Originators, and Huntsman (Europe) B.V.B.A., as Master Servicer (incorporated by reference to Exhibit 10.23 to our annual report on Form 10-K for the year ended December 31, 2000) |
|
10.15 |
Third Amendment, dated as of November 30, 2001, by and among Huntsman International LLC, Huntsman International Holdings LLC and the various agents and lending institutions party thereto (incorporated by reference to Exhibit 10.1 to our current report on Form 8-K filed December 4, 2001) |
|
10.16 |
Fourth Amendment to Credit Agreement, dated as of March 15, 2002, by and among Huntsman International LLC, Huntsman International Holdings LLC and the various agents and lending institutions party thereto (incorporated by reference to Exhibit 10.25 to amendment no. 1 to our annual report on Form 10-K/A for the year ended December 31, 2001) |
|
10.17 |
Amendment Agreement, dated December 20, 2001, between Imperial Chemical Industries PLC, Huntsman Specialty Chemicals Corporation, Huntsman International Holdings LLC and Huntsman International LLC, to amend the Contribution Agreement dated as of April 15, 1999 (incorporated by reference to Exhibit 10.26 to our registration statement on Form S-4 (File No. 333-106482)) |
|
10.18 |
Second Amendment, dated as of October 21, 2002, between Huntsman Receivables Finance LLC, Huntsman (Europe), BVBA, and J.P. Morgan (Ireland) PLC, to Series 2000-1 Supplement, dated as of December 21, 2000 (incorporated by reference to Exhibit 10.27 to our annual report on Form 10-K for the year ended December 31, 2002) |
|
10.19 |
First Amendment to Series 2001-1 Supplement, dated as of October 21, 2002, among Huntsman Receivables Finance LLC, Huntsman (Europe) BVBA and J.P. Morgan Bank (Ireland) PLC (incorporated by reference to Exhibit 10.28 to our annual report on Form 10-K for the year ended December 31, 2002) |
|
10.20 |
First Amendment to Amended and Restated Pooling Agreement, dated as of October 21, 2002, among Huntsman Receivables Finance LLC, Huntsman (Europe) BVBA and J.P. Morgan Bank (Ireland) PLC (incorporated by reference to Exhibit 10.29 to our annual report on Form 10-K for the year ended December 31, 2002) |
|
10.21 |
Amended and Restated Servicing Agreement, dated as of October 21, 2002, among Huntsman Receivables Finance LLC, as the Company, Huntsman (Europe) BVBA, as Master Servicer, Tioxide Americas Inc., Huntsman Holland B.V., Tioxide Europe Limited, Huntsman International LLC, Huntsman Petrochemicals (UK) Limited, Huntsman Propylene Oxide Ltd., Huntsman International Fuels L.P., Tioxide Europe SRL, Huntsman Surface Sciences Italia SRL, Huntsman Patrica S.R.L., Tioxide Europe S.L., Huntsman Surface Sciences Ibérica, S.L., Tioxide Europe SAS, Huntsman Surface Sciences (France) S.A.S., Huntsman Surface Sciences UK Ltd, Huntsman Ethyleneamines Ltd., as Local Servicers, J.P. Morgan Bank (Ireland) PLC, as Trustee, Pricewaterhousecoopers, as Liquidation Servicer, and Huntsman International LLC, as Servicer Guarantor (incorporated by reference to Exhibit 10.30 to our annual report on Form 10-K for the year ended December 31, 2002) |
|
10.22 |
Amended and Restated U.S. Receivables Purchase Agreement, dated as of October 21, 2002, among Huntsman International LLC, as Purchaser, and Tioxide Americas Inc., Huntsman Propylene Oxide Ltd., Huntsman International Fuels L.P., and Huntsman Ethyleneamines Ltd., each as a Seller and an Originator (incorporated by reference to Exhibit 10.31 to our annual report on Form 10-K for the year ended December 31, 2002) |
|
10.23 |
Amended and Restated UK Receivables Purchase Agreement, dated as of October 21, 2002, among Huntsman International LLC, as Purchaser, Huntsman Surface Sciences UK Limited, Tioxide Europe Limited, and Huntsman Petrochemicals (UK) Limited, as Originators, Huntsman (Europe) B.V.B.A, as Master Servicer (incorporated by reference to Exhibit 10.32 to our annual report on Form 10-K for the year ended December 31, 2002) |
|
10.24 |
Fifth Amendment to Credit Agreement, dated as of February 7, 2003, among Huntsman International LLC, Huntsman International Holdings LLC and the various agents and lending institutions party thereto (incorporated by reference to Exhibit 10.33 to our annual report on Form 10-K for the year ended December 31, 2002) |
|
10.25 |
Deed of Amendment to Contribution Agreement, dated as of November 27, 2002, among Imperial Chemical Industries PLC, Huntsman Specialty Chemicals Corporation, Huntsman International Holdings, LLC, and Huntsman International LLC (incorporated by reference to Exhibit 10.34 to our annual report on Form 10-K for the year ended December 31, 2002) |
|
10.26 |
Sixth Amendment to Credit Agreement, dated as of April 9, 2003, among Huntsman International LLC, Huntsman International Holdings LLC and the various agents and lending institutions party thereto (incorporated by reference to Exhibit 10.1 to our quarterly report on Form 10-Q for the quarter ended March 31, 2003) |
|
10.27 |
Business Consulting Agreement, dated as of June 3, 2003, between Huntsman International LLC and Jon M. Huntsman (incorporated by reference to Exhibit 10.41 to our registration statement on Form S-4 (File No. 333-106482)) |
|
10.28 |
Seventh Amendment to Credit Agreement, dated as of October 17, 2003, among Huntsman International LLC, Huntsman International Holdings LLC and the various agents and lending institutions party thereto (incorporated by reference to Exhibit 10.42 to our registration statement on Form S-4 (File No. 333-106482)) |
|
14.1 |
Financial Code of Ethics |
|
21.1 |
Subsidiaries of Huntsman International LLC |
|
31.1 |
Certification of Chief Executive Officer pursuant to Section 302 of the Sarbanes-Oxley Act of 2002 |
|
31.2 |
Certification of Chief Financial Officer pursuant to Section 302 of the Sarbanes-Oxley Act of 2002 |
|
32.1 |
Certifications of Chief Executive Officer pursuant to Section 906 of the Sarbanes-Oxley Act of 2002 |
|
32.2 |
Certifications of Chief Financial Officer pursuant to Section 906 of the Sarbanes-Oxley Act of 2002 |